QUANTA SERVICES INC, QUANTA SERVICES MANAGEMENT ...
QUANTA SERVICES INC, QUANTA SERVICES MANAGEMENT ...
QUANTA SERVICES INC, QUANTA SERVICES MANAGEMENT ...

Create successful ePaper yourself
Turn your PDF publications into a flip-book with our unique Google optimized e-Paper software.
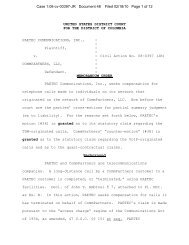
Consolidated Results<br />
Year Ended December 31,<br />
2011 2010 2009<br />
Revenues .............................. $4,623,829 100.0% $3,931,218 100.0% $3,318,126 100.0%<br />
Cost of services (including depreciation) ...... 4,003,230 86.6 3,296,795 83.9 2,724,638 82.1<br />
Gross profit ............................. 620,599 13.4 634,423 16.1 593,488 17.9<br />
Selling, general and administrative expenses . . . 372,963 8.1 339,672 8.6 312,414 9.4<br />
Amortization of intangible assets ............ 29,953 0.6 38,568 1.0 38,952 1.2<br />
Operating income ........................ 217,683 4.7 256,183 6.5 242,122 7.3<br />
Interest expense ......................... (1,821) — (4,913) (0.1) (11,269) (0.3)<br />
Interest income .......................... 1,066 — 1,417 — 2,456 —<br />
Loss on early extinguishment of debt, net ..... — — (7,107) (0.2) — —<br />
Other income (expense), net ................ (558) — 675 — 421 —<br />
Income before income taxes ................ 216,370 4.7 246,255 6.2 233,730 7.0<br />
Provision for income taxes ................. 71,954 1.6 90,698 2.3 70,195 2.1<br />
Net income ......................... 144,416 3.1 155,557 3.9 163,535 4.9<br />
Less: Net income attributable to noncontrolling<br />
interests .............................. 11,901 0.2 2,381 — 1,373 —<br />
Net income attributable to common<br />
stock ............................ $ 132,515 2.9% $ 153,176 3.9% $ 162,162 4.9%<br />
2011 compared to 2010<br />
Revenues. Revenues increased $692.6 million, or 17.6%, to $4.62 billion for the year ended<br />
December 31, 2011. Electric power infrastructure service revenues increased $981.4 million, or 47.9%, to $3.03<br />
billion for the year ended December 31, 2011, primarily due to an increase in the number and size of projects as a<br />
result of increased capital spending by our customers, the contribution of $242.2 million in revenues from<br />
acquired businesses and an increase of $76.7 million in revenues from emergency restoration services during<br />
2011 as compared to 2010. Also contributing to the overall revenue increase were higher revenues from<br />
telecommunications infrastructure services, which increased $84.3 million, or 22.6%, to $457.3 million,<br />
primarily as a result of increased capital spending by our customers. Partially offsetting these increases were<br />
lower revenues from natural gas and pipeline infrastructure services, which decreased $378.4 million, or 27.0%,<br />
to $1.02 billion for the year ended December 31, 2011 primarily due to a decrease in the number and size of<br />
natural gas transmission projects that were ongoing during 2011 as compared to 2010.<br />
Gross profit. Gross profit decreased $13.8 million, or 2.2%, to $620.6 million for the year ended<br />
December 31, 2011. As a percentage of revenues, gross margin decreased to 13.4% for the year ended<br />
December 31, 2011 from 16.1% for the year ended December 31, 2010. These decreases were primarily due to<br />
the impact of lower overall revenues from natural gas and pipeline infrastructure services, which resulted in a<br />
lower ability to cover operating overhead costs, as well as the impact of project losses incurred by this segment<br />
during 2011 that primarily resulted from increased project costs related to productivity issues caused by adverse<br />
weather conditions and more stringent application of regulations. Also contributing to these decreases was the<br />
impact of a $32.6 million charge to the Natural Gas and Pipeline Infrastructure Services segment’s cost of<br />
services in the fourth quarter of 2011 associated with the withdrawal of certain of our subsidiaries from an<br />
underfunded multi-employer pension plan. Gross margins were also negatively impacted in 2011 as a result of a<br />
decrease in margins earned by the Electric Power Infrastructure Services segment primarily due to the<br />
completion of certain higher margin electric transmission projects during the year ended December 31, 2010, as<br />
compared to electric transmission projects that were at earlier stages of completion during the year ended<br />
December 31, 2011. The decrease in gross profit was partially offset by the impact of higher overall revenues<br />
from the Electric Power Infrastructure Services segment and the Telecommunications Infrastructure Services<br />
segment as described above.<br />
42