

Medicare Payment Policy
Medicare Payment Policy
Medicare Payment Policy

You also want an ePaper? Increase the reach of your titles
YUMPU automatically turns print PDFs into web optimized ePapers that Google loves.
tABLe<br />
9–2<br />
of services. The review also examines quality of care,<br />
access to capital, and the relationship between <strong>Medicare</strong>’s<br />
payments and providers’ costs. Overall, the <strong>Medicare</strong><br />
payment adequacy indicators for HHAs are positive.<br />
Beneficiaries’ access to care: Almost all<br />
beneficiaries live in an area served by home<br />
health care<br />
Supply and volume indicators show that almost all<br />
beneficiaries have access to home health services. In 2011,<br />
almost all beneficiaries (99.5 percent) lived in a ZIP code<br />
served by at least one HHA, 98 percent lived in a ZIP code<br />
served by two or more HHAs, and over 80 percent lived in<br />
a ZIP code served by five or more agencies. These findings<br />
are consistent with our review of access from prior years. 4<br />
Capacity and supply of providers: Agency<br />
supply surpasses previous peak<br />
In 2011, there were 12,199 HHAs participating in<br />
<strong>Medicare</strong>, a net increase of about 512 agencies compared<br />
with the previous year. Most new agencies in 2011 were<br />
for-profit agencies. The number of agencies exceeded<br />
the previous record of the 1990s when supply exceeded<br />
10,900 agencies. The high rate of growth is a particular<br />
concern, as the new agencies appear to be concentrated in<br />
areas with fraud issues, including California, Florida, and<br />
Texas. These states, like most, do not have state certificateof-need<br />
laws for home health care, which can limit the<br />
entry of new providers. 5<br />
Since 2004, when 99 percent of beneficiaries lived in a<br />
ZIP code served by an HHA, the number of agencies per<br />
10,000 FFS beneficiaries has risen 60 percent, from 2.0 to<br />
194 Home health care services: Assessing payment adequacy and updating payments<br />
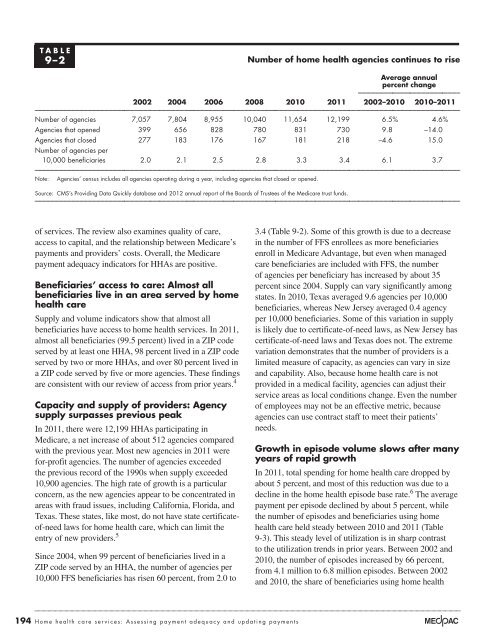
number of home health agencies continues to rise<br />
Average annual<br />
percent change<br />
2002 2004 2006 2008 2010 2011 2002–2010 2010–2011<br />
Number of agencies 7,057 7,804 8,955 10,040 11,654 12,199 6.5% 4.6%<br />
Agencies that opened 399 656 828 780 831 730 9.8 –14.0<br />
Agencies that closed<br />
Number of agencies per<br />
277 183 176 167 181 218 –4.6 15.0<br />
10,000 beneficiaries 2.0 2.1 2.5 2.8 3.3 3.4 6.1 3.7<br />
Note: Agencies’ census includes all agencies operating during a year, including agencies that closed or opened.<br />
Source: CMS’s Providing Data Quickly database and 2012 annual report of the Boards of Trustees of the <strong>Medicare</strong> trust funds.<br />
3.4 (Table 9-2). Some of this growth is due to a decrease<br />
in the number of FFS enrollees as more beneficiaries<br />
enroll in <strong>Medicare</strong> Advantage, but even when managed<br />
care beneficiaries are included with FFS, the number<br />
of agencies per beneficiary has increased by about 35<br />
percent since 2004. Supply can vary significantly among<br />
states. In 2010, Texas averaged 9.6 agencies per 10,000<br />
beneficiaries, whereas New Jersey averaged 0.4 agency<br />
per 10,000 beneficiaries. Some of this variation in supply<br />
is likely due to certificate-of-need laws, as New Jersey has<br />
certificate-of-need laws and Texas does not. The extreme<br />
variation demonstrates that the number of providers is a<br />
limited measure of capacity, as agencies can vary in size<br />
and capability. Also, because home health care is not<br />
provided in a medical facility, agencies can adjust their<br />
service areas as local conditions change. Even the number<br />
of employees may not be an effective metric, because<br />
agencies can use contract staff to meet their patients’<br />
needs.<br />
growth in episode volume slows after many<br />
years of rapid growth<br />
In 2011, total spending for home health care dropped by<br />
about 5 percent, and most of this reduction was due to a<br />
decline in the home health episode base rate. 6 The average<br />
payment per episode declined by about 5 percent, while<br />
the number of episodes and beneficiaries using home<br />
health care held steady between 2010 and 2011 (Table<br />
9-3). This steady level of utilization is in sharp contrast<br />
to the utilization trends in prior years. Between 2002 and<br />
2010, the number of episodes increased by 66 percent,<br />
from 4.1 million to 6.8 million episodes. Between 2002<br />
and 2010, the share of beneficiaries using home health