

Medicare Payment Policy
Medicare Payment Policy
Medicare Payment Policy

Create successful ePaper yourself
Turn your PDF publications into a flip-book with our unique Google optimized e-Paper software.
tABLe<br />
12–11<br />
Hospice characteristic<br />
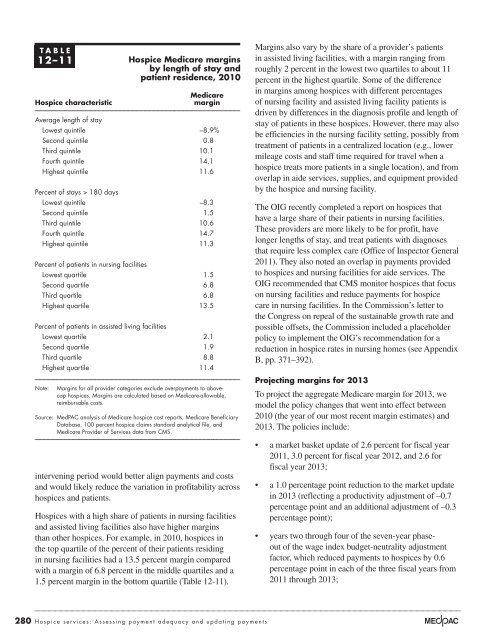
Hospice <strong>Medicare</strong> margins<br />
by length of stay and<br />
patient residence, 2010<br />
<strong>Medicare</strong><br />
margin<br />
Average length of stay<br />
Lowest quintile –8.9%<br />
Second quintile 0.8<br />
Third quintile 10.1<br />
Fourth quintile 14.1<br />
Highest quintile 11.6<br />
Percent of stays > 180 days<br />
Lowest quintile –8.3<br />
Second quintile 1.5<br />
Third quintile 10.6<br />
Fourth quintile 14.7<br />
Highest quintile 11.3<br />
Percent of patients in nursing facilities<br />
Lowest quartile 1.5<br />
Second quartile 6.8<br />
Third quartile 6.8<br />
Highest quartile 13.5<br />
Percent of patients in assisted living facilities<br />
Lowest quartile 2.1<br />
Second quartile 1.9<br />
Third quartile 8.8<br />
Highest quartile 11.4<br />
Note: Margins for all provider categories exclude overpayments to abovecap<br />
hospices. Margins are calculated based on <strong>Medicare</strong>-allowable,<br />
reimbursable costs.<br />
Source: MedPAC analysis of <strong>Medicare</strong> hospice cost reports, <strong>Medicare</strong> Beneficiary<br />
Database, 100 percent hospice claims standard analytical file, and<br />
<strong>Medicare</strong> Provider of Services data from CMS.<br />
intervening period would better align payments and costs<br />
and would likely reduce the variation in profitability across<br />
hospices and patients.<br />
Hospices with a high share of patients in nursing facilities<br />
and assisted living facilities also have higher margins<br />
than other hospices. For example, in 2010, hospices in<br />
the top quartile of the percent of their patients residing<br />
in nursing facilities had a 13.5 percent margin compared<br />
with a margin of 6.8 percent in the middle quartiles and a<br />
1.5 percent margin in the bottom quartile (Table 12-11).<br />
280 Hospice services: Assessing payment adequacy and updating payments<br />
Margins also vary by the share of a provider’s patients<br />
in assisted living facilities, with a margin ranging from<br />
roughly 2 percent in the lowest two quartiles to about 11<br />
percent in the highest quartile. Some of the difference<br />
in margins among hospices with different percentages<br />
of nursing facility and assisted living facility patients is<br />
driven by differences in the diagnosis profile and length of<br />
stay of patients in these hospices. However, there may also<br />
be efficiencies in the nursing facility setting, possibly from<br />
treatment of patients in a centralized location (e.g., lower<br />
mileage costs and staff time required for travel when a<br />
hospice treats more patients in a single location), and from<br />
overlap in aide services, supplies, and equipment provided<br />
by the hospice and nursing facility.<br />
The OIG recently completed a report on hospices that<br />
have a large share of their patients in nursing facilities.<br />
These providers are more likely to be for profit, have<br />
longer lengths of stay, and treat patients with diagnoses<br />
that require less complex care (Office of Inspector General<br />
2011). They also noted an overlap in payments provided<br />
to hospices and nursing facilities for aide services. The<br />
OIG recommended that CMS monitor hospices that focus<br />
on nursing facilities and reduce payments for hospice<br />
care in nursing facilities. In the Commission’s letter to<br />
the Congress on repeal of the sustainable growth rate and<br />
possible offsets, the Commission included a placeholder<br />
policy to implement the OIG’s recommendation for a<br />
reduction in hospice rates in nursing homes (see Appendix<br />
B, pp. 371–392).<br />
projecting margins for 2013<br />
To project the aggregate <strong>Medicare</strong> margin for 2013, we<br />
model the policy changes that went into effect between<br />
2010 (the year of our most recent margin estimates) and<br />
2013. The policies include:<br />
• a market basket update of 2.6 percent for fiscal year<br />
2011, 3.0 percent for fiscal year 2012, and 2.6 for<br />
fiscal year 2013;<br />
• a 1.0 percentage point reduction to the market update<br />
in 2013 (reflecting a productivity adjustment of –0.7<br />
percentage point and an additional adjustment of –0.3<br />
percentage point);<br />
• years two through four of the seven-year phaseout<br />
of the wage index budget-neutrality adjustment<br />
factor, which reduced payments to hospices by 0.6<br />
percentage point in each of the three fiscal years from<br />
2011 through 2013;