

Continuous Improvement and the Expansion of Quality ... - NCQA
Continuous Improvement and the Expansion of Quality ... - NCQA
Continuous Improvement and the Expansion of Quality ... - NCQA

Create successful ePaper yourself
Turn your PDF publications into a flip-book with our unique Google optimized e-Paper software.
T H E S TAT E o f H E A l T H C A R E Q U A l I T y 2 0 1 1 • H E D I S M E A S U R E S o f C A R E<br />
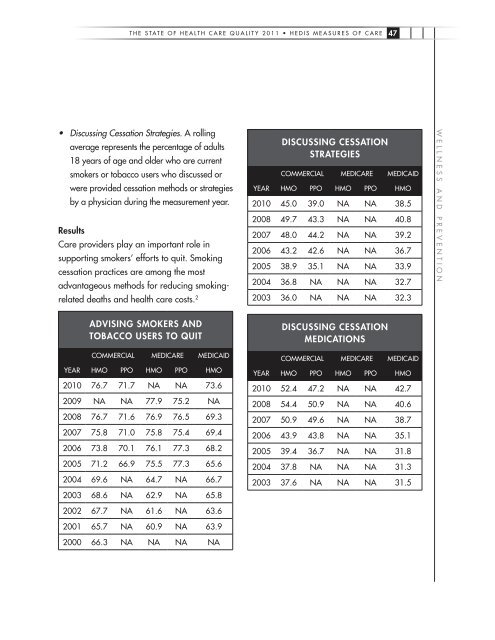
• Discussing Cessation Strategies. A rolling<br />
average represents <strong>the</strong> percentage <strong>of</strong> adults<br />
18 years <strong>of</strong> age <strong>and</strong> older who are current<br />
smokers or tobacco users who discussed or<br />
were provided cessation methods or strategies<br />
by a physician during <strong>the</strong> measurement year.<br />
results<br />
Care providers play an important role in<br />
supporting smokers’ efforts to quit. Smoking<br />
cessation practices are among <strong>the</strong> most<br />
advantageous methods for reducing smokingrelated<br />
deaths <strong>and</strong> health care costs. 2<br />
yEAR<br />
advIsIng sMokErs <strong>and</strong><br />
tobaCCo usErs to QuIt<br />
CoMMERCIAl MEDICARE MEDICAID<br />
HMo PPo HMo PPo HMo<br />
2010 76.7 71.7 NA NA 73.6<br />
2009 NA NA 77.9 75.2 NA<br />
2008 76.7 71.6 76.9 76.5 69.3<br />
2007 75.8 71.0 75.8 75.4 69.4<br />
2006 73.8 70.1 76.1 77.3 68.2<br />
2005 71.2 66.9 75.5 77.3 65.6<br />
2004 69.6 NA 64.7 NA 66.7<br />
2003 68.6 NA 62.9 NA 65.8<br />
2002 67.7 NA 61.6 NA 63.6<br />
2001 65.7 NA 60.9 NA 63.9<br />
2000 66.3 NA NA NA NA<br />
yEAR<br />
dIsCussIng CEssatIon<br />
stratEgIEs<br />
CoMMERCIAl MEDICARE MEDICAID<br />
HMo PPo HMo PPo HMo<br />
2010 45.0 39.0 NA NA 38.5<br />
2008 49.7 43.3 NA NA 40.8<br />
2007 48.0 44.2 NA NA 39.2<br />
2006 43.2 42.6 NA NA 36.7<br />
2005 38.9 35.1 NA NA 33.9<br />
2004 36.8 NA NA NA 32.7<br />
2003 36.0 NA NA NA 32.3<br />
yEAR<br />
dIsCussIng CEssatIon<br />
MEdICatIons<br />
47<br />
CoMMERCIAl MEDICARE MEDICAID<br />
HMo PPo HMo PPo HMo<br />
2010 52.4 47.2 NA NA 42.7<br />
2008 54.4 50.9 NA NA 40.6<br />
2007 50.9 49.6 NA NA 38.7<br />
2006 43.9 43.8 NA NA 35.1<br />
2005 39.4 36.7 NA NA 31.8<br />
2004 37.8 NA NA NA 31.3<br />
2003 37.6 NA NA NA 31.5<br />
W E l l N E S S A N D P R E V E N T I o N