TOOLED THICK COMPOSITES by ARVEN H. SAUNDERS III ...
TOOLED THICK COMPOSITES by ARVEN H. SAUNDERS III ...
TOOLED THICK COMPOSITES by ARVEN H. SAUNDERS III ...

You also want an ePaper? Increase the reach of your titles
YUMPU automatically turns print PDFs into web optimized ePapers that Google loves.
Resin Pressure (Pa)<br />
1.2E+06<br />
1.0E+06<br />
8.0E+05<br />
6.0E+05<br />
4.0E+05<br />
2.0E+05<br />
0.0E+00<br />
1 3 5 7 9 11 13 15 17 19 21 23 25<br />
Position along Flexbeam Length<br />
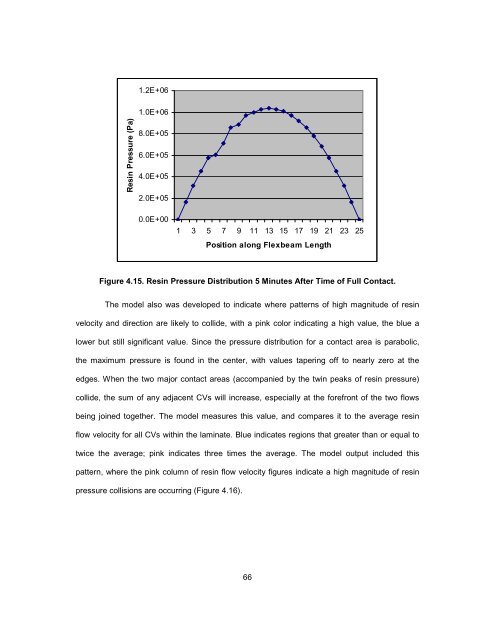
Figure 4.15. Resin Pressure Distribution 5 Minutes After Time of Full Contact.<br />
The model also was developed to indicate where patterns of high magnitude of resin<br />
velocity and direction are likely to collide, with a pink color indicating a high value, the blue a<br />
lower but still significant value. Since the pressure distribution for a contact area is parabolic,<br />
the maximum pressure is found in the center, with values tapering off to nearly zero at the<br />
edges. When the two major contact areas (accompanied <strong>by</strong> the twin peaks of resin pressure)<br />
collide, the sum of any adjacent CVs will increase, especially at the forefront of the two flows<br />
being joined together. The model measures this value, and compares it to the average resin<br />
flow velocity for all CVs within the laminate. Blue indicates regions that greater than or equal to<br />
twice the average; pink indicates three times the average. The model output included this<br />
pattern, where the pink column of resin flow velocity figures indicate a high magnitude of resin<br />
pressure collisions are occurring (Figure 4.16).<br />
66