Housing and Support Program (HASP): Final Evaluation Report
Housing and Support Program (HASP): Final Evaluation Report
Housing and Support Program (HASP): Final Evaluation Report

Create successful ePaper yourself
Turn your PDF publications into a flip-book with our unique Google optimized e-Paper software.
40<br />
Section 4 The process of providing clinical, non-clinical<br />
<strong>and</strong> housing services to clients<br />
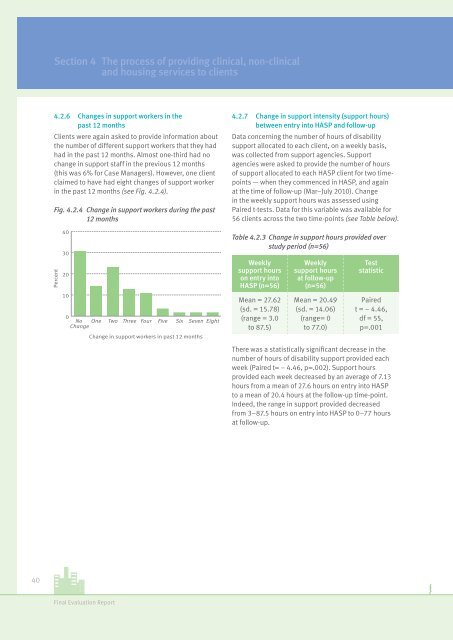
4.2.6 Changes in support workers in the<br />
past 12 months<br />
Clients were again asked to provide information about<br />
the number of different support workers that they had<br />
had in the past 12 months. Almost one-third had no<br />
change in support staff in the previous 12 months<br />
(this was 6% for Case Managers). However, one client<br />
claimed to have had eight changes of support worker<br />
in the past 12 months (see Fig. 4.2.4).<br />
Fig. 4.2.4 Change in support workers during the past<br />
12 months<br />
Percent<br />
40<br />
30<br />
20<br />
10<br />
0<br />
No<br />
Change<br />
One<br />
Two<br />
<strong>Final</strong> <strong>Evaluation</strong> <strong>Report</strong><br />
Three<br />
Four<br />
Five<br />
Six<br />
Seven Eight<br />
Change in support workers in past 12 months<br />
4.2.7 Change in support intensity (support hours)<br />
between entry into <strong>HASP</strong> <strong>and</strong> follow-up<br />
Data concerning the number of hours of disability<br />
support allocated to each client, on a weekly basis,<br />
was collected from support agencies. <strong>Support</strong><br />
agencies were asked to provide the number of hours<br />
of support allocated to each <strong>HASP</strong> client for two timepoints<br />
— when they commenced in <strong>HASP</strong>, <strong>and</strong> again<br />
at the time of follow-up (Mar–July 2010). Change<br />
in the weekly support hours was assessed using<br />
Paired t-tests. Data for this variable was available for<br />
56 clients across the two time-points (see Table below).<br />
Table 4.2.3 Change in support hours provided over<br />
study period (n=56)<br />
Weekly<br />
support hours<br />
on entry into<br />
<strong>HASP</strong> (n=56)<br />
Mean = 27.62<br />
(sd. = 15.78)<br />
(range = 3.0<br />
to 87.5)<br />
Weekly<br />
support hours<br />
at follow-up<br />
(n=56)<br />
Mean = 20.49<br />
(sd. = 14.06)<br />
(range= 0<br />
to 77.0)<br />
Test<br />
statistic<br />
Paired<br />
t = – 4.46,<br />
df = 55,<br />
p=.001<br />
There was a statistically signifi cant decrease in the<br />
number of hours of disability support provided each<br />
week (Paired t= – 4.46, p=.002). <strong>Support</strong> hours<br />
provided each week decreased by an average of 7.13<br />
hours from a mean of 27.6 hours on entry into <strong>HASP</strong><br />
to a mean of 20.4 hours at the follow-up time-point.<br />
Indeed, the range in support provided decreased<br />
from 3–87.5 hours on entry into <strong>HASP</strong> to 0–77 hours<br />
at follow-up.