

YK CENTRIFUGAL LIQUID CHILLER OptiView ... - Johnson Controls
YK CENTRIFUGAL LIQUID CHILLER OptiView ... - Johnson Controls
YK CENTRIFUGAL LIQUID CHILLER OptiView ... - Johnson Controls

Create successful ePaper yourself
Turn your PDF publications into a flip-book with our unique Google optimized e-Paper software.
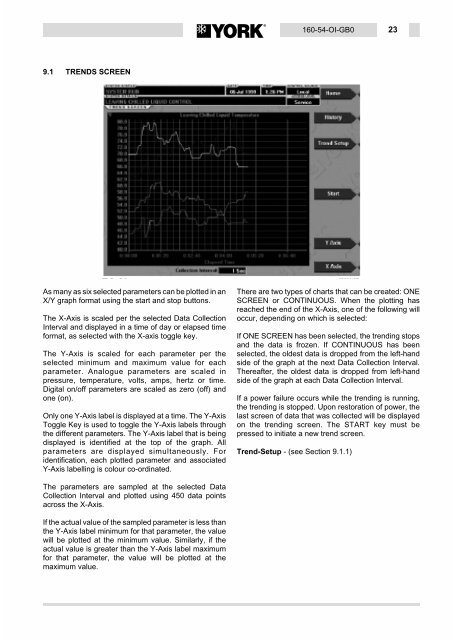
9.1 TRENDS SCREEN<br />
As many as six selected parameters can be plotted in an<br />
X/Y graph format using the start and stop buttons.<br />
The X-Axis is scaled per the selected Data Collection<br />
Interval and displayed in a time of day or elapsed time<br />
format, as selected with the X-axis toggle key.<br />
The Y-Axis is scaled for each parameter per the<br />
selected minimum and maximum value for each<br />
parameter. Analogue parameters are scaled in<br />
pressure, temperature, volts, amps, hertz or time.<br />
Digital on/off parameters are scaled as zero (off) and<br />
one (on).<br />
Only one Y-Axis label is displayed at a time. The Y-Axis<br />
Toggle Key is used to toggle the Y-Axis labels through<br />
the different parameters. The Y-Axis label that is being<br />
displayed is identified at the top of the graph. All<br />
parameters are displayed simultaneously. For<br />
identification, each plotted parameter and associated<br />
Y-Axis labelling is colour co-ordinated.<br />
The parameters are sampled at the selected Data<br />
Collection Interval and plotted using 450 data points<br />
across the X-Axis.<br />
If the actual value of the sampled parameter is less than<br />
the Y-Axis label minimum for that parameter, the value<br />
will be plotted at the minimum value. Similarly, if the<br />
actual value is greater than the Y-Axis label maximum<br />
for that parameter, the value will be plotted at the<br />
maximum value.<br />
160-54-OI-GB0 23<br />
There are two types of charts that can be created: ONE<br />
SCREEN or CONTINUOUS. When the plotting has<br />
reached the end of the X-Axis, one of the following will<br />
occur, depending on which is selected:<br />
If ONE SCREEN has been selected, the trending stops<br />
and the data is frozen. If CONTINUOUS has been<br />
selected, the oldest data is dropped from the left-hand<br />
side of the graph at the next Data Collection Interval.<br />
Thereafter, the oldest data is dropped from left-hand<br />
side of the graph at each Data Collection Interval.<br />
If a power failure occurs while the trending is running,<br />
the trending is stopped. Upon restoration of power, the<br />
last screen of data that was collected will be displayed<br />
on the trending screen. The START key must be<br />
pressed to initiate a new trend screen.<br />
Trend-Setup - (see Section 9.1.1)


![[PDF] •Outdoor installation 4-5 - Johnson Controls](https://img.yumpu.com/10374038/1/184x260/pdf-ooutdoor-installation-4-5-johnson-controls.jpg?quality=85)

![[PDF] The European Products Catalogue 2012 - Johnson Controls](https://img.yumpu.com/3624903/1/184x260/pdf-the-european-products-catalogue-2012-johnson-controls.jpg?quality=85)