Download PDF - Hiscox
Download PDF - Hiscox
Download PDF - Hiscox

Create successful ePaper yourself
Turn your PDF publications into a flip-book with our unique Google optimized e-Paper software.
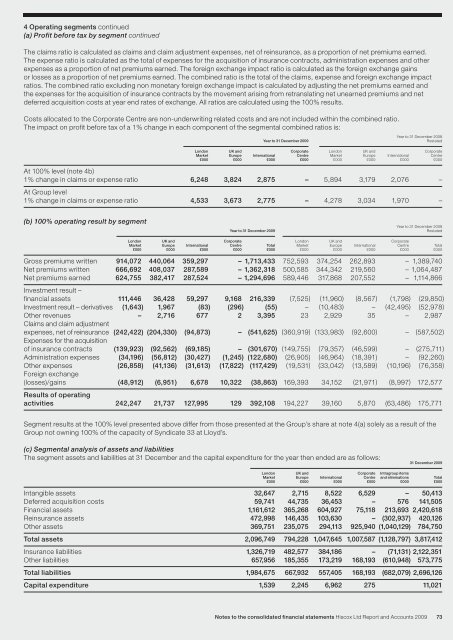
4 Operating segments continued<br />
(a) Profit before tax by segment continued<br />
The claims ratio is calculated as claims and claim adjustment expenses, net of reinsurance, as a proportion of net premiums earned.<br />
The expense ratio is calculated as the total of expenses for the acquisition of insurance contracts, administration expenses and other<br />
expenses as a proportion of net premiums earned. The foreign exchange impact ratio is calculated as the foreign exchange gains<br />
or losses as a proportion of net premiums earned. The combined ratio is the total of the claims, expense and foreign exchange impact<br />
ratios. The combined ratio excluding non monetary foreign exchange impact is calculated by adjusting the net premiums earned and<br />
the expenses for the acquisition of insurance contracts by the movement arising from retranslating net unearned premiums and net<br />
deferred acquisition costs at year end rates of exchange. All ratios are calculated using the 100% results.<br />
Costs allocated to the Corporate Centre are non-underwriting related costs and are not included within the combined ratio.<br />
The impact on profit before tax of a 1% change in each component of the segmental combined ratios is:<br />
Year to 31 December 2008<br />
Year to 31 December 2009 Restated<br />
London UK and Corporate London UK and Corporate<br />
Market Europe International Centre Market Europe International Centre<br />
£000 £000 £000 £000 £000 £000 £000 £000<br />
At 100% level (note 4b)<br />
1% change in claims or expense ratio<br />
At Group level<br />
6,248 3,824 2,875 – 5,894 3,179 2,076 –<br />
1% change in claims or expense ratio 4,533 3,673 2,775 – 4,278 3,034 1,970 –<br />
(b) 100% operating result by segment<br />
Year to 31 December 2008<br />
Year to 31 December 2009 Restated<br />
London UK and Corporate London UK and Corporate<br />
Market Europe International Centre Total Market Europe International Centre Total<br />
£000 £000 £000 £000 £000 £000 £000 £000 £000 £000<br />
Gross premiums written 914,072 440,064 359,297 – 1,713,433 752,593 374,254 262,893 – 1,389,740<br />
Net premiums written 666,692 408,037 287,589 – 1,362,318 500,585 344,342 219,560 – 1,064,487<br />
Net premiums earned<br />
Investment result –<br />
624,755 382,417 287,524 – 1,294,696 589,446 317,868 207,552 – 1,114,866<br />
financial assets 111,446 36,428 59,297 9,168 216,339 (7,525) (11,960) (8,567) (1,798) (29,850)<br />
Investment result – derivatives (1,643) 1,967 (83) (296) (55) – (10,483) – (42,495) (52,978)<br />
Other revenues<br />
Claims and claim adjustment<br />
– 2,716 677 2 3,395 23 2,929 35 – 2,987<br />
expenses, net of reinsurance (242,422) (204,330)<br />
Expenses for the acquisition<br />
(94,873) – (541,625) (360,919) (133,983) (92,600) – (587,502)<br />
of insurance contracts (139,923) (92,562) (69,185) – (301,670) (149,755) (79,357) (46,599) – (275,711)<br />
Administration expenses (34,196) (56,812) (30,427) (1,245) (122,680) (26,905) (46,964) (18,391) – (92,260)<br />
Other expenses<br />
Foreign exchange<br />
(26,858) (41,136) (31,613) (17,822) (117,429) (19,531) (33,042) (13,589) (10,196) (76,358)<br />
(losses)/gains<br />
Results of operating<br />
(48,912) (6,951) 6,678 10,322 (38,863) 169,393 34,152 (21,971) (8,997) 172,577<br />
activities 242,247 21,737 127,995 129 392,108 194,227 39,160 5,870 (63,486) 175,771<br />
Segment results at the 100% level presented above differ from those presented at the Group’s share at note 4(a) solely as a result of the<br />
Group not owning 100% of the capacity of Syndicate 33 at Lloyd’s.<br />
(c) Segmental analysis of assets and liabilities<br />
The segment assets and liabilities at 31 December and the capital expenditure for the year then ended are as follows:<br />
31 December 2009<br />
London UK and Corporate Intragroup items<br />
Market Europe International Centre and eliminations Total<br />
£000 £000 £000 £000 £000 £000<br />
Intangible assets 32,647 2,715 8,522 6,529 – 50,413<br />
Deferred acquisition costs 59,741 44,735 36,453 – 576 141,505<br />
Financial assets 1,161,612 365,268 604,927 75,118 213,693 2,420,618<br />
Reinsurance assets 472,998 146,435 103,630 – (302,937) 420,126<br />
Other assets 369,751 235,075 294,113 925,940 (1,040,129) 784,750<br />
Total assets 2,096,749 794,228 1,047,645 1,007,587 (1,128,797) 3,817,412<br />
Insurance liabilities 1,326,719 482,577 384,186 – (71,131) 2,122,351<br />
Other liabilities 657,956 185,355 173,219 168,193 (610,948) 573,775<br />
Total liabilities 1,984,675 667,932 557,405 168,193 (682,079) 2,696,126<br />
Capital expenditure 1,539 2,245 6,962 275 11,021<br />
Notes to the consolidated financial statements <strong>Hiscox</strong> Ltd Report and Accounts 2009 73