Download PDF - Hiscox
Download PDF - Hiscox
Download PDF - Hiscox

You also want an ePaper? Increase the reach of your titles
YUMPU automatically turns print PDFs into web optimized ePapers that Google loves.
Notes to the consolidated<br />
financial statements<br />
continued<br />
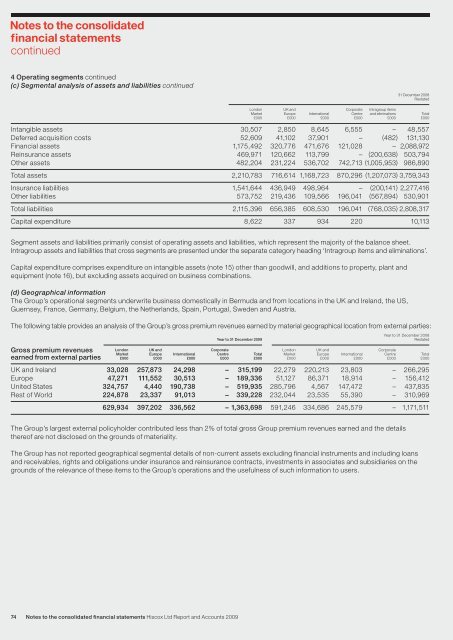
4 Operating segments continued<br />
(c) Segmental analysis of assets and liabilities continued<br />
74 Notes to the consolidated financial statements <strong>Hiscox</strong> Ltd Report and Accounts 2009<br />
31 December 2008<br />
Restated<br />
London UK and Corporate Intragroup items<br />
Market Europe International Centre and eliminations Total<br />
£000 £000 £000 £000 £000 £000<br />
Intangible assets 30,507 2,850 8,645 6,555 – 48,557<br />
Deferred acquisition costs 52,609 41,102 37,901 – (482) 131,130<br />
Financial assets 1,175,492 320,776 471,676 121,028 – 2,088,972<br />
Reinsurance assets 469,971 120,662 113,799 – (200,638) 503,794<br />
Other assets 482,204 231,224 536,702 742,713 (1,005,953) 986,890<br />
Total assets 2,210,783 716,614 1,168,723 870,296 (1,207,073) 3,759,343<br />
Insurance liabilities 1,541,644 436,949 498,964 – (200,141) 2,277,416<br />
Other liabilities 573,752 219,436 109,566 196,041 (567,894) 530,901<br />
Total liabilities 2,115,396 656,385 608,530 196,041 (768,035) 2,808,317<br />
Capital expenditure 8,622 337 934 220 10,113<br />
Segment assets and liabilities primarily consist of operating assets and liabilities, which represent the majority of the balance sheet.<br />
Intragroup assets and liabilities that cross segments are presented under the separate category heading ‘Intragroup items and eliminations’.<br />
Capital expenditure comprises expenditure on intangible assets (note 15) other than goodwill, and additions to property, plant and<br />
equipment (note 16), but excluding assets acquired on business combinations.<br />
(d) Geographical information<br />
The Group’s operational segments underwrite business domestically in Bermuda and from locations in the UK and Ireland, the US,<br />
Guernsey, France, Germany, Belgium, the Netherlands, Spain, Portugal, Sweden and Austria.<br />
The following table provides an analysis of the Group’s gross premium revenues earned by material geographical location from external parties:<br />
Gross premium revenues<br />
Year to 31 December 2008<br />
Year to 31 December 2009 Restated<br />
London UK and Corporate London UK and Corporate<br />
earned from external parties<br />
Market<br />
£000<br />
Europe<br />
£000<br />
International<br />
£000<br />
Centre<br />
£000<br />
Total<br />
£000<br />
Market<br />
£000<br />
Europe<br />
£000<br />
International<br />
£000<br />
Centre<br />
£000<br />
Total<br />
£000<br />
UK and Ireland 33,028 257,873 24,298 – 315,199 22,279 220,213 23,803 – 266,295<br />
Europe 47,271 111,552 30,513 – 189,336 51,127 86,371 18,914 – 156,412<br />
United States 324,757 4,440 190,738 – 519,935 285,796 4,567 147,472 – 437,835<br />
Rest of World 224,878 23,337 91,013 – 339,228 232,044 23,535 55,390 – 310,969<br />
629,934 397,202 336,562 – 1,363,698 591,246 334,686 245,579 – 1,171,511<br />
The Group’s largest external policyholder contributed less than 2% of total gross Group premium revenues earned and the details<br />
thereof are not disclosed on the grounds of materiality.<br />
The Group has not reported geographical segmental details of non-current assets excluding financial instruments and including loans<br />
and receivables, rights and obligations under insurance and reinsurance contracts, investments in associates and subsidiaries on the<br />
grounds of the relevance of these items to the Group’s operations and the usefulness of such information to users.