Download PDF - Hiscox
Download PDF - Hiscox
Download PDF - Hiscox

You also want an ePaper? Increase the reach of your titles
YUMPU automatically turns print PDFs into web optimized ePapers that Google loves.
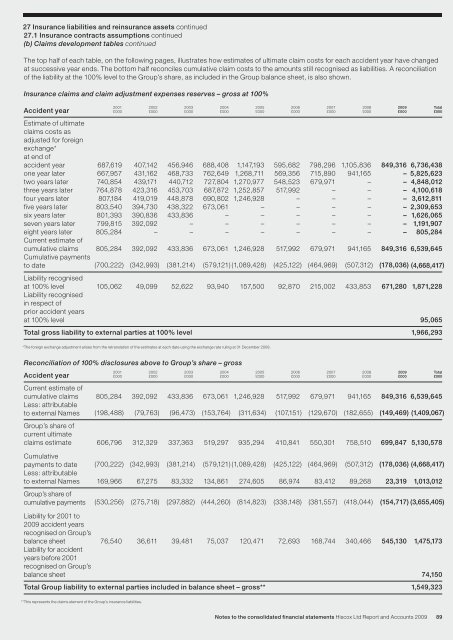
27 Insurance liabilities and reinsurance assets continued<br />
27.1 Insurance contracts assumptions continued<br />
(b) Claims development tables continued<br />
The top half of each table, on the following pages, illustrates how estimates of ultimate claim costs for each accident year have changed<br />
at successive year ends. The bottom half reconciles cumulative claim costs to the amounts still recognised as liabilities. A reconciliation<br />
of the liability at the 100% level to the Group’s share, as included in the Group balance sheet, is also shown.<br />
Insurance claims and claim adjustment expenses reserves – gross at 100%<br />
2001 2002 2003 2004 2005 2006 2007 2008 2009 Total<br />
Accident year £000 £000 £000 £000 £000 £000 £000 £000 £000 £000<br />
Estimate of ultimate<br />
claims costs as<br />
adjusted for foreign<br />
exchange*<br />
at end of<br />
accident year 687,619 407,142 456,946 688,408 1,147,193 595,682 798,296 1,105,836 849,316 6,736,438<br />
one year later 667,957 431,162 468,733 762,649 1,268,711 569,356 715,890 941,165 – 5,825,623<br />
two years later 740,854 439,171 440,712 727,804 1,270,977 548,523 679,971 – – 4,848,012<br />
three years later 764,878 423,316 453,703 687,872 1,252,857 517,992 – – – 4,100,618<br />
four years later 807,184 419,019 448,878 690,802 1,246,928 – – – – 3,612,811<br />
five years later 803,540 394,730 438,322 673,061 – – – – – 2,309,653<br />
six years later 801,393 390,836 433,836 – – – – – – 1,626,065<br />
seven years later 799,815 392,092 – – – – – – – 1,191,907<br />
eight years later<br />
Current estimate of<br />
805,284 – – – – – – – – 805,284<br />
cumulative claims<br />
Cumulative payments<br />
805,284 392,092 433,836 673,061 1,246,928 517,992 679,971 941,165 849,316 6,539,645<br />
to date<br />
Liability recognised<br />
(700,222) (342,993) (381,214) (579,121) (1,089,428) (425,122) (464,969) (507,312) (178,036) (4,668,417)<br />
at 100% level<br />
Liability recognised<br />
in respect of<br />
prior accident years<br />
105,062 49,099 52,622 93,940 157,500 92,870 215,002 433,853 671,280 1,871,228<br />
at 100% level 95,065<br />
Total gross liability to external parties at 100% level 1,966,293<br />
*The foreign exchange adjustment arises from the retranslation of the estimates at each date using the exchange rate ruling at 31 December 2009.<br />
Reconciliation of 100% disclosures above to Group’s share – gross<br />
2001 2002 2003 2004 2005 2006 2007 2008 2009 Total<br />
Accident year £000 £000 £000 £000 £000 £000 £000 £000 £000 £000<br />
Current estimate of<br />
cumulative claims<br />
Less: attributable<br />
805,284 392,092 433,836 673,061 1,246,928 517,992 679,971 941,165 849,316 6,539,645<br />
to external Names<br />
Group’s share of<br />
current ultimate<br />
(198,488) (79,763) (96,473) (153,764) (311,634) (107,151) (129,670) (182,655) (149,469) (1,409,067)<br />
claims estimate 606,796 312,329 337,363 519,297 935,294 410,841 550,301 758,510 699,847 5,130,578<br />
Cumulative<br />
payments to date<br />
Less: attributable<br />
(700,222) (342,993) (381,214) (579,121) (1,089,428) (425,122) (464,969) (507,312) (178,036) (4,668,417)<br />
to external Names<br />
Group’s share of<br />
169,966 67,275 83,332 134,861 274,605 86,974 83,412 89,268 23,319 1,013,012<br />
cumulative payments (530,256) (275,718) (297,882) (444,260) (814,823) (338,148) (381,557) (418,044) (154,717) (3,655,405)<br />
Liability for 2001 to<br />
2009 accident years<br />
recognised on Group’s<br />
balance sheet 76,540 36,611 39,481 75,037 120,471 72,693 168,744 340,466 545,130 1,475,173<br />
Liability for accident<br />
years before 2001<br />
recognised on Group’s<br />
balance sheet 74,150<br />
Total Group liability to external parties included in balance sheet – gross** 1,549,323<br />
**This represents the claims element of the Group’s insurance liabilities.<br />
Notes to the consolidated financial statements <strong>Hiscox</strong> Ltd Report and Accounts 2009<br />
89