PROCEEDINGS OF THE 7 INTERNATIONAL ... - Fizika
PROCEEDINGS OF THE 7 INTERNATIONAL ... - Fizika
PROCEEDINGS OF THE 7 INTERNATIONAL ... - Fizika

Create successful ePaper yourself
Turn your PDF publications into a flip-book with our unique Google optimized e-Paper software.
D. Kaskelyte et al. / Medical Physics in the Baltic States 7 (2009) 20 - 23<br />
we measured the fluorescence of the myogenic cells<br />
stained with PKH 67 marker in suspension being<br />
squeezed between gelatine-milk slices. The data<br />
obtained by changing fiber probe’s depth in the<br />
samples were used to construct 2D fluorescence<br />
intensity plots to determine the sensitivity of the<br />
fluorescence excitation / collection unit and to evaluate<br />
the resolvable spatial range in the fluorescing<br />
specimen.<br />
3. Results<br />
The fluorescence intensity values of rhodamine 6G in<br />
gelatine layer were collected automatically by<br />
changing the depth of fiber probe within the sample in<br />
every 0.07 mm while for PKH 67 – in every 0.05 mm.<br />
The sensitivity of the designed system during the<br />
measurements was sufficiently high to register the<br />
changes in the fluorescence signal of the markers while<br />
fiber probe was gradually moved from one layer to the<br />
next deeper laying layer. Fig.4 shows the fluorescence<br />
intensity of rhodamine 6G marker being collected by<br />
passing the needle fiber tip through the model layered<br />
sample, which is plotted as a depth and wavelength<br />
function. The measurements indicate that the fiberoptic<br />
probe collects information about the localization<br />
of the marked layer.<br />
Fig. 4. Set of fluorescence intensity of rhodamine 6G marker<br />
layer, which has been collected at different fiber tip probing<br />
depths (bottom plots). Fluorescing rhodamine 6G – gelatine–<br />
milk layer (3 mm in thickness) has been covered with the<br />
thick slice (13 mm) of breast tissue. Upper plot represents<br />
distribution of the fluorescence intensity of the marker at 542<br />
nm emission wavelength along the layered specimen.<br />
Slight increase in the background fluorescence signal<br />
measured under the fluorescing layer was observed for<br />
rhodamine 6G / gelatine layer system. It can be<br />
explained as a result of slight staining of the needle<br />
fiber tip caused by the rhodamine 6G, attached to it<br />
from the marked layer. The increased background<br />
fluorescence signal vanished moving the needle deeper<br />
into the sample for about 2 mm.<br />
22<br />
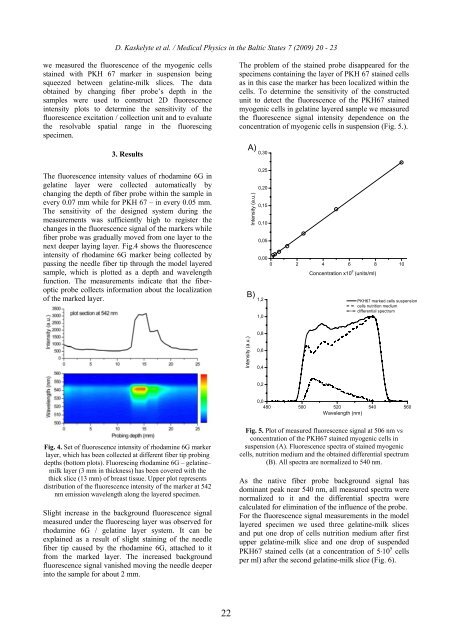
The problem of the stained probe disappeared for the<br />
specimens containing the layer of PKH 67 stained cells<br />
as in this case the marker has been localized within the<br />
cells. To determine the sensitivity of the constructed<br />
unit to detect the fluorescence of the PKH67 stained<br />
myogenic cells in gelatine layered sample we measured<br />
the fluorescence signal intensity dependence on the<br />
concentration of myogenic cells in suspension (Fig. 5.).<br />
Intensity (a.u.)<br />
A)<br />
Intensity (a.u.)<br />
B)<br />
0,30<br />
0,25<br />
0,20<br />
0,15<br />
0,10<br />
0,05<br />
0,00<br />
0 2 4 6 8 10<br />
1,2<br />
1,0<br />
0,8<br />
0,6<br />
0,4<br />
0,2<br />
Concentration x10 6 (units/ml)<br />
PKH67 marked cells suspension<br />
cells nutrition medium<br />
differential spectrum<br />
0,0<br />
480 500 520<br />
Wavelength (nm)<br />
540 560<br />
Fig. 5. Plot of measured fluorescence signal at 506 nm vs<br />
concentration of the PKH67 stained myogenic cells in<br />
suspension (A). Fluorescence spectra of stained myogenic<br />
cells, nutrition medium and the obtained differential spectrum<br />
(B). All spectra are normalized to 540 nm.<br />
As the native fiber probe background signal has<br />
dominant peak near 540 nm, all measured spectra were<br />
normalized to it and the differential spectra were<br />
calculated for elimination of the influence of the probe.<br />
For the fluorescence signal measurements in the model<br />
layered specimen we used three gelatine-milk slices<br />
and put one drop of cells nutrition medium after first<br />
upper gelatine-milk slice and one drop of suspended<br />
PKH67 stained cells (at a concentration of 5⋅10 5 cells<br />
per ml) after the second gelatine-milk slice (Fig. 6).