- Page 1: ANNUAL REPORT 2 0 1 0 -1 1 MICRO, S
- Page 4 and 5: Annual Report 2010-11 ii MSME
- Page 6 and 7: Annual Report 2010-11 Annexure No.
- Page 8 and 9: Annual Report 2010-11 KVI Khadi and
- Page 10: Annual Report 2010-11 viii MSME
- Page 14 and 15: Annual Report 2010-11 Chapter I - I
- Page 16 and 17: Annual Report 2010-11 Chapter I - I
- Page 18 and 19: Annual Report 2010-11 Chapter I - I
- Page 20: Annual Report 2010-11 10 MSME
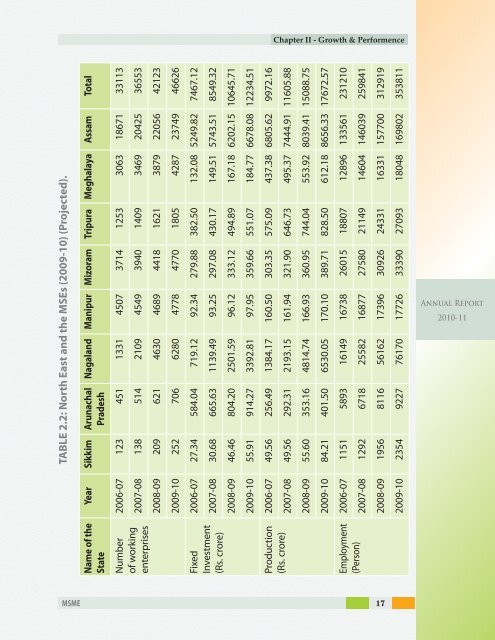
- Page 24 and 25: Annual Report 2010-11 Chapter II -
- Page 28 and 29: Annual Report 2010-11 Chapter II -
- Page 30 and 31: Annual Report 2010-11 Chapter II -
- Page 32 and 33: Annual Report 2010-11 Chapter II -
- Page 34 and 35: Annual Report 2010-11 Chapter II -
- Page 36: Annual Report 2010-11 Chapter II -
- Page 40 and 41: Annual Report 2010-11 Chapter III -
- Page 42 and 43: Annual Report 2010-11 Chapter III -
- Page 44 and 45: Annual Report 2010-11 Chapter III -
- Page 46 and 47: Annual Report 2010-11 Chapter III -
- Page 48 and 49: Annual Report 2010-11 Chapter III -
- Page 50 and 51: Annual Report 2010-11 Chapter III -
- Page 52 and 53: Annual Report 2010-11 Chapter III -
- Page 54 and 55: Annual Report 2010-11 Chapter III -
- Page 56 and 57: Annual Report 2010-11 Chapter III -
- Page 58 and 59: Annual Report 2010-11 Chapter III -
- Page 60 and 61: Annual Report 2010-11 Chapter III -
- Page 62 and 63: Annual Report 2010-11 Chapter III -
- Page 64 and 65: Annual Report 2010-11 Chapter III -
- Page 66 and 67: Annual Report 2010-11 Chapter III -
- Page 68 and 69: Annual Report 2010-11 Chapter III -
- Page 70 and 71: Annual Report 2010-11 Chapter III -
- Page 72 and 73: Annual Report 2010-11 Chapter III -
- Page 74: Annual Report 2010-11 64 MSME
- Page 78 and 79:
Annual Report 2010-11 Chapter IV -
- Page 80 and 81:
Annual Report 2010-11 Chapter IV -
- Page 82 and 83:
Annual Report 2010-11 Chapter IV -
- Page 84 and 85:
Annual Report 2010-11 Chapter IV -
- Page 86 and 87:
Annual Report 2010-11 Chapter IV -
- Page 88 and 89:
Annual Report 2010-11 Chapter IV -
- Page 90 and 91:
Annual Report 2010-11 Chapter IV -
- Page 92 and 93:
Annual Report 2010-11 Chapter IV -
- Page 94 and 95:
Annual Report 2010-11 Chapter IV -
- Page 96 and 97:
Annual Report 2010-11 Chapter IV -
- Page 98 and 99:
Annual Report 2010-11 Chapter IV -
- Page 100 and 101:
Annual Report 2010-11 Chapter IV -
- Page 102 and 103:
Annual Report 2010-11 Chapter IV -
- Page 104 and 105:
Annual Report 2010-11 Chapter IV -
- Page 106 and 107:
Annual Report 2010-11 Chapter IV -
- Page 108 and 109:
Annual Report 2010-11 Chapter IV -
- Page 110 and 111:
Annual Report 2010-11 Chapter IV -
- Page 112 and 113:
Annual Report 2010-11 Chapter IV -
- Page 114 and 115:
Annual Report 2010-11 Chapter IV -
- Page 116 and 117:
Annual Report 2010-11 Chapter IV -
- Page 118:
Annual Report 2010-11 108 MSME
- Page 122 and 123:
Annual Report 2010-11 Chapter -V KV
- Page 124 and 125:
Annual Report 2010-11 Chapter -V KV
- Page 126 and 127:
Annual Report 2010-11 Chapter -V KV
- Page 128 and 129:
Annual Report 2010-11 Chapter -V KV
- Page 130 and 131:
Annual Report 2010-11 Chapter -V KV
- Page 132 and 133:
Annual Report 2010-11 Chapter -V KV
- Page 134 and 135:
Annual Report 2010-11 Chapter -V KV
- Page 136 and 137:
Annual Report 2010-11 Chapter -V KV
- Page 138 and 139:
Annual Report 2010-11 Chapter -V KV
- Page 140:
Annual Report 2010-11 Chapter -V KV
- Page 144 and 145:
Annual Report 2010-11 Chapter -VI M
- Page 146:
Annual Report 2010-11 136 MSME
- Page 150 and 151:
Annual Report 2010-11 Chapter -VII
- Page 152 and 153:
Annual Report 2010-11 Chapter -VII
- Page 154 and 155:
Annual Report 2010-11 Chapter -VII
- Page 156 and 157:
Annual Report 2010-11 Chapter -VII
- Page 158 and 159:
Annual Report 2010-11 Chapter -VII
- Page 160:
Annual Report 2010-11 Chapter -VII
- Page 164 and 165:
Annual Report 2010-11 Chapter -VIII
- Page 166 and 167:
Annual Report 2010-11 Chapter -VIII
- Page 168 and 169:
Annual Report 2010-11 Chapter -VIII
- Page 170 and 171:
Annual Report 2010-11 Chapter -VIII
- Page 172 and 173:
Annual Report 2010-11 Chapter -VIII
- Page 174 and 175:
Annual Report 2010-11 Chapter -VIII
- Page 176 and 177:
Annual Report 2010-11 Chapter -VIII
- Page 178 and 179:
Annual Report 2010-11 Chapter -VIII
- Page 180:
Annual Report 2010-11 Chapter -VIII
- Page 184 and 185:
Annual Report 2010-11 Chapter -IX E
- Page 186 and 187:
Annual Report 2010-11 Chapter -IX E
- Page 188 and 189:
Annual Report 2010-11 Chapter -IX E
- Page 190 and 191:
Annual Report 2010-11 Chapter -IX E
- Page 192 and 193:
Annual Report 2010-11 Chapter -IX E
- Page 194 and 195:
Annual Report 2010-11 Chapter -IX E
- Page 196 and 197:
Annual Report 2010-11 Chapter -IX E
- Page 198 and 199:
Annual Report 2010-11 Chapter -IX E
- Page 200 and 201:
Annual Report 2010-11 Chapter -IX E
- Page 202 and 203:
Annual Report 2010-11 Chapter -IX E
- Page 204 and 205:
Annual Report 2010-11 Chapter -IX E
- Page 206 and 207:
Annual Report 2010-11 Chapter -IX E
- Page 208:
Annual Report 2010-11 198 MSME
- Page 212 and 213:
Annual Report 2010-11 Chapter -X PM
- Page 214 and 215:
Annual Report 2010-11 Chapter -X PM
- Page 216 and 217:
Annual Report 2010-11 Chapter -X PM
- Page 218:
Annual Report 2010-11 Chapter -X PM
- Page 222 and 223:
Annual Report 2010-11 Chapter -XI I
- Page 224 and 225:
Annual Report 2010-11 Chapter -XI I
- Page 226 and 227:
Annual Report 2010-11 Chapter -XI I
- Page 228 and 229:
Annual Report 2010-11 Chapter -XI I
- Page 230 and 231:
Annual Report 2010-11 Chapter -XI I
- Page 232 and 233:
Annual Report 2010-11 Chapter -XI I
- Page 234 and 235:
Annual Report 2010-11 Chapter -XI I
- Page 236 and 237:
Annual Report 2010-11 Chapter -XI I
- Page 238:
Annual Report 2010-11 Chapter -XI I
- Page 242 and 243:
Annual Report 2010-11 Chapter -XII
- Page 244 and 245:
Annual Report 2010-11 Chapter -XII
- Page 246 and 247:
Annual Report 2010-11 Chapter -XII
- Page 248 and 249:
Annual Report 2010-11 Chapter -XII
- Page 250 and 251:
Annual Report 2010-11 Chapter -XII
- Page 252 and 253:
Annual Report 2010-11 Chapter -XII
- Page 254 and 255:
Annual Report 2010-11 Chapter -XII
- Page 256:
Annual Report 2010-11 246 MSME
- Page 260 and 261:
Annual Report 2010-11 Chapter -XIII
- Page 262:
Annual Report 2010-11 Chapter -XIII
- Page 266 and 267:
Annual Report 2010-11 Chapter -XIV
- Page 268 and 269:
Annual Report 2010-11 Chapter -XIV
- Page 270 and 271:
Annual Report 2010-11 Chapter -XIV
- Page 272:
Annual Report 2010-11 262 MSME
- Page 276 and 277:
Annual Report 2010-11 Chapter -XV V
- Page 278:
Annual Report 2010-11 268 MSME
- Page 282 and 283:
Annual Report 2010-11 Chapter -XVI
- Page 284 and 285:
Annual Report 2010-11 Chapter -XVI
- Page 286 and 287:
Annual Report 2010-11 Chapter -XVI
- Page 288 and 289:
Annual Report 2010-11 Annexure-I Co
- Page 290 and 291:
Annual Report 2010-11 Annexure-I Co
- Page 292 and 293:
Annual Report 2010-11 Annexure-I Co
- Page 294 and 295:
Annual Report 2010-11 Annexure-I Co
- Page 296 and 297:
Annual Report 2010-11 Annexure-I Co
- Page 298 and 299:
Annual Report 2010-11 Annexure-I Co
- Page 300 and 301:
Annual Report 2010-11 Annexure-I Co
- Page 302 and 303:
Annual Report 2010-11 Annexure-I Co
- Page 304 and 305:
Annual Report 2010-11 Annexure-I Co
- Page 306 and 307:
Annual Report 2010-11 Annexure-I Co
- Page 308 and 309:
Annual Report 2010-11 Annexure-I Co
- Page 310 and 311:
Annual Report 2010-11 Annexure-I Co
- Page 312 and 313:
Annual Report 2010-11 Annexure-I Co
- Page 314 and 315:
Annual Report 2010-11 Annexure-I Co
- Page 316 and 317:
Annual Report 2010-11 Annexure-I Co
- Page 318 and 319:
Annual Report 2010-11 Annexure-I Co
- Page 320 and 321:
Annual Report 2010-11 Annexure-II 3
- Page 322 and 323:
Annual Report 2010-11 Annexure-III
- Page 324 and 325:
Annual Report 2010-11 Annexure-IV C
- Page 326 and 327:
Annual Report 2010-11 Annexure-IV C
- Page 328 and 329:
Annual Report 2010-11 Annexure-IV C
- Page 330 and 331:
Annual Report 2010-11 Annexure-IV C
- Page 332 and 333:
Annual Report 2010-11 Annexure-IV C
- Page 334 and 335:
Annual Report 2010-11 Annexure-IV C
- Page 336 and 337:
Annual Report 2010-11 Annexure-V Co
- Page 338 and 339:
Annual Report 2010-11 Annexure-VII
- Page 340 and 341:
Annual Report 2010-11 Annexure-VIII
- Page 342 and 343:
Annual Report 2010-11 Annexure-VIII
- Page 344 and 345:
Annual Report 2010-11 Annexure-VIII
- Page 346 and 347:
Annual Report 2010-11 Annexure-IX C
- Page 348 and 349:
Annual Report 2010-11 Annexure-IX C
- Page 350 and 351:
Annual Report 2010-11 Annexure-IX C
- Page 352 and 353:
Annual Report 2010-11 Annexure-IX C
- Page 354 and 355:
Annual Report 2010-11 Annexure-IX C
- Page 356 and 357:
Annual Report 2010-11 Annexure-IX C
- Page 358:
Annual Report 2010-11 348 MSME
- Page 361:
Designed and Printed at : CHANDU PR