PDF file - Facultatea de Chimie şi Inginerie Chimică
PDF file - Facultatea de Chimie şi Inginerie Chimică
PDF file - Facultatea de Chimie şi Inginerie Chimică

Create successful ePaper yourself
Turn your PDF publications into a flip-book with our unique Google optimized e-Paper software.
178<br />
T. PERNYESZI, K. HONFI, B. BOROS, K. TÁLOS, F. KILÁR, C. MAJDIK<br />
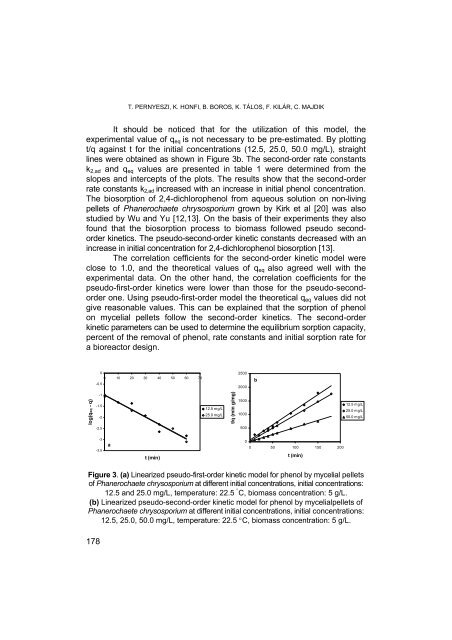
It should be noticed that for the utilization of this mo<strong>de</strong>l, the<br />
experimental value of qeq is not necessary to be pre-estimated. By plotting<br />
t/q against t for the initial concentrations (12.5, 25.0, 50.0 mg/L), straight<br />
lines were obtained as shown in Figure 3b. The second-or<strong>de</strong>r rate constants<br />
k2,ad and qeq values are presented in table 1 were <strong>de</strong>termined from the<br />
slopes and intercepts of the plots. The results show that the second-or<strong>de</strong>r<br />
rate constants k2,ad increased with an increase in initial phenol concentration.<br />
The biosorption of 2,4-dichlorophenol from aqueous solution on non-living<br />
pellets of Phanerochaete chrysosporium grown by Kirk et al [20] was also<br />
studied by Wu and Yu [12,13]. On the basis of their experiments they also<br />
found that the biosorption process to biomass followed pseudo secondor<strong>de</strong>r<br />
kinetics. The pseudo-second-or<strong>de</strong>r kinetic constants <strong>de</strong>creased with an<br />
increase in initial concentration for 2,4-dichlorophenol biosorption [13].<br />
The correlation cefficients for the second-or<strong>de</strong>r kinetic mo<strong>de</strong>l were<br />
close to 1.0, and the theoretical values of qeq also agreed well with the<br />
experimental data. On the other hand, the correlation coefficients for the<br />
pseudo-first-or<strong>de</strong>r kinetics were lower than those for the pseudo-secondor<strong>de</strong>r<br />
one. Using pseudo-first-or<strong>de</strong>r mo<strong>de</strong>l the theoretical qeq values did not<br />
give reasonable values. This can be explained that the sorption of phenol<br />
on mycelial pellets follow the second-or<strong>de</strong>r kinetics. The second-or<strong>de</strong>r<br />
kinetic parameters can be used to <strong>de</strong>termine the equilibrium sorption capacity,<br />
percent of the removal of phenol, rate constants and initial sorption rate for<br />
a bioreactor <strong>de</strong>sign.<br />
log(qeq - q)<br />
-0.5<br />
-1<br />
-1.5<br />
-2<br />
-2.5<br />
-3<br />
-3.5<br />
0<br />
0 10 20 30 40 50 60 70<br />
a<br />
t (min)<br />
12.5 mg/L<br />
25.0 mg/L<br />
t/q (min g/mg)<br />
2500<br />
2000<br />
1500<br />
1000<br />
500<br />
0<br />
b<br />
0 50 100 150 200<br />
t (min)<br />
12.5 mg/L<br />
25.0 mg/L<br />
50.0 mg/L<br />
Figure 3. (a) Linearized pseudo-first-or<strong>de</strong>r kinetic mo<strong>de</strong>l for phenol by mycelial pellets<br />
of Phanerochaete chrysosporium at different initial concentrations, initial concentrations:<br />
12.5 and 25.0 mg/L, temperature: 22.5 ° C, biomass concentration: 5 g/L.<br />
(b) Linearized pseudo-second-or<strong>de</strong>r kinetic mo<strong>de</strong>l for phenol by mycelialpellets of<br />
Phanerochaete chrysosporium at different initial concentrations, initial concentrations:<br />
12.5, 25.0, 50.0 mg/L, temperature: 22.5 °C, biomass concentration: 5 g/L.