PDF file - Facultatea de Chimie şi Inginerie Chimică
PDF file - Facultatea de Chimie şi Inginerie Chimică
PDF file - Facultatea de Chimie şi Inginerie Chimică

Create successful ePaper yourself
Turn your PDF publications into a flip-book with our unique Google optimized e-Paper software.
RED PEPPER POWDER COLOR MEASUREMENT BY USING AN INTEGRATING SPHERE …<br />
The samples reflect the light only over 500 nm. A group of spectrum<br />
(samples PS3 and PS6) exhibits a continuous, monotone increase of reflectance<br />
versus the wavelengths. For the other group of spectra (PS2, PS8, PS12 and<br />
PS15) the presence of local maxima and minimum are the characteristic<br />
feature of the increasing reflectance values versus the wavelength.<br />
The local maxima appear at ~ 600 nm and at ~ 640 nm, respectively,<br />
the minimum appears at the 670 nm, <strong>de</strong>spite of the pepper brand. In the<br />
later cases, the spectra look like a superposed molecular spectrum of three<br />
different colorants in the 530 – 700 nm spectral domain. This fact suggests<br />
the presence of three, yellow and red, colorants in the pepper pow<strong>de</strong>r in<br />
higher concentrations.<br />
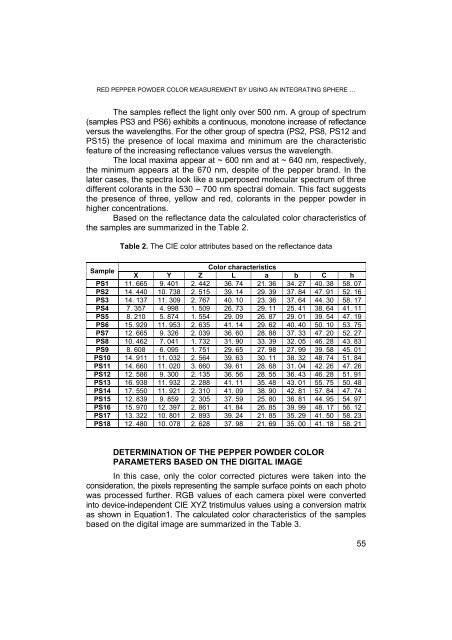
Based on the reflectance data the calculated color characteristics of<br />
the samples are summarized in the Table 2.<br />
Table 2. The CIE color attributes based on the reflectance data<br />
Sample<br />
X Y Z<br />
Color characteristics<br />
L a b C h<br />
PS1 11. 665 9. 401 2. 442 36. 74 21. 36 34. 27 40. 38 58. 07<br />
PS2 14. 440 10. 738 2. 515 39. 14 29. 39 37. 84 47. 91 52. 16<br />
PS3 14. 137 11. 309 2. 767 40. 10 23. 36 37. 64 44. 30 58. 17<br />
PS4 7. 357 4. 998 1. 509 26. 73 29. 11 25. 41 38. 64 41. 11<br />
PS5 8. 210 5. 874 1. 554 29. 09 26. 87 29. 01 39. 54 47. 19<br />
PS6 15. 929 11. 953 2. 635 41. 14 29. 62 40. 40 50. 10 53. 75<br />
PS7 12. 665 9. 326 2. 039 36. 60 28. 88 37. 33 47. 20 52. 27<br />
PS8 10. 462 7. 041 1. 732 31. 90 33. 39 32. 05 46. 28 43. 83<br />
PS9 8. 608 6. 095 1. 751 29. 65 27. 98 27. 99 39. 58 45. 01<br />
PS10 14. 911 11. 032 2. 564 39. 63 30. 11 38. 32 48. 74 51. 84<br />
PS11 14. 660 11. 020 3. 660 39. 61 28. 68 31. 04 42. 26 47. 26<br />
PS12 12. 586 9. 300 2. 135 36. 56 28. 55 36. 43 46. 28 51. 91<br />
PS13 16. 938 11. 932 2. 288 41. 11 35. 48 43. 01 55. 75 50. 48<br />
PS14 17. 550 11. 921 2. 310 41. 09 38. 90 42. 81 57. 84 47. 74<br />
PS15 12. 839 9. 859 2. 305 37. 59 25. 80 36. 81 44. 95 54. 97<br />
PS16 15. 970 12. 397 2. 861 41. 84 26. 85 39. 99 48. 17 56. 12<br />
PS17 13. 322 10. 801 2. 893 39. 24 21. 85 35. 29 41. 50 58. 23<br />
PS18 12. 480 10. 078 2. 628 37. 98 21. 69 35. 00 41. 18 58. 21<br />
DETERMINATION OF THE PEPPER POWDER COLOR<br />
PARAMETERS BASED ON THE DIGITAL IMAGE<br />
In this case, only the color corrected pictures were taken into the<br />
consi<strong>de</strong>ration, the pixels representing the sample surface points on each photo<br />
was processed further. RGB values of each camera pixel were converted<br />
into <strong>de</strong>vice-in<strong>de</strong>pen<strong>de</strong>nt CIE XYZ tristimulus values using a conversion matrix<br />
as shown in Equation1. The calculated color characteristics of the samples<br />
based on the digital image are summarized in the Table 3.<br />
55