PDF file - Facultatea de Chimie şi Inginerie Chimică
PDF file - Facultatea de Chimie şi Inginerie Chimică
PDF file - Facultatea de Chimie şi Inginerie Chimică

You also want an ePaper? Increase the reach of your titles
YUMPU automatically turns print PDFs into web optimized ePapers that Google loves.
BIOSORPTION OF PHENOL FROM AQUEOUS SOLUTIONS BY FUNGAL BIOMASS ...<br />
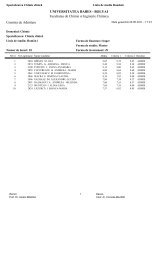
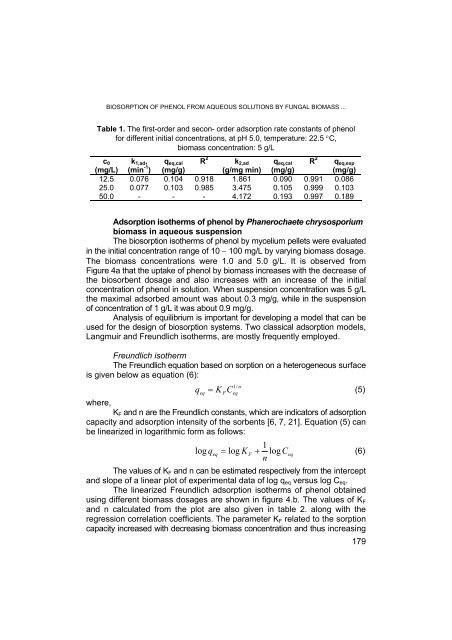
Table 1. The first-or<strong>de</strong>r and secon- or<strong>de</strong>r adsorption rate constants of phenol<br />
for different initial concentrations, at pH 5.0, temperature: 22.5 °C,<br />
biomass concentration: 5 g/L<br />
c0<br />
(mg/L)<br />
k1,ad,<br />
(min -1 )<br />
qeq,cal<br />
(mg/g)<br />
R 2 k2,ad<br />
(g/mg min)<br />
qeq,cal<br />
(mg/g)<br />
R 2 qeq,exp<br />
(mg/g)<br />
12.5 0.076 0.104 0.918 1.861 0.090 0.991 0.086<br />
25.0 0.077 0.103 0.985 3.475 0.105 0.999 0.103<br />
50.0 - - - 4.172 0.193 0.997 0.189<br />
Adsorption isotherms of phenol by Phanerochaete chrysosporium<br />
biomass in aqueous suspension<br />
The biosorption isotherms of phenol by mycelium pellets were evaluated<br />
in the initial concentration range of 10 − 100 mg/L by varying biomass dosage.<br />
The biomass concentrations were 1.0 and 5.0 g/L. It is observed from<br />
Figure 4a that the uptake of phenol by biomass increases with the <strong>de</strong>crease of<br />
the biosorbent dosage and also increases with an increase of the initial<br />
concentration of phenol in solution. When suspension concentration was 5 g/L<br />
the maximal adsorbed amount was about 0.3 mg/g, while in the suspension<br />
of concentration of 1 g/L it was about 0.9 mg/g.<br />
Analysis of equilibrium is important for <strong>de</strong>veloping a mo<strong>de</strong>l that can be<br />
used for the <strong>de</strong>sign of biosorption systems. Two classical adsorption mo<strong>de</strong>ls,<br />
Langmuir and Freundlich isotherms, are mostly frequently employed.<br />
Freundlich isotherm<br />
The Freundlich equation based on sorption on a heterogeneous surface<br />
is given below as equation (6):<br />
1/<br />
n<br />
qeq<br />
= K FCeq<br />
(5)<br />
where,<br />
KF and n are the Freundlich constants, which are indicators of adsorption<br />
capacity and adsorption intensity of the sorbents [6, 7, 21]. Equation (5) can<br />
be linearized in logarithmic form as follows:<br />
1<br />
log qeq = log K F + logC<br />
eq<br />
(6)<br />
n<br />
The values of KF and n can be estimated respectively from the intercept<br />
and slope of a linear plot of experimental data of log qeq versus log Ceq.<br />
The linearized Freundlich adsorption isotherms of phenol obtained<br />
using different biomass dosages are shown in figure 4.b. The values of KF<br />
and n calculated from the plot are also given in table 2. along with the<br />
regression correlation coefficients. The parameter KF related to the sorption<br />
capacity increased with <strong>de</strong>creasing biomass concentration and thus increasing<br />
179