nr. 477 - 2011 - Institut for Natur, Systemer og Modeller (NSM)
nr. 477 - 2011 - Institut for Natur, Systemer og Modeller (NSM)
nr. 477 - 2011 - Institut for Natur, Systemer og Modeller (NSM)

Create successful ePaper yourself
Turn your PDF publications into a flip-book with our unique Google optimized e-Paper software.
5.8 Discussion of Parameters 37<br />
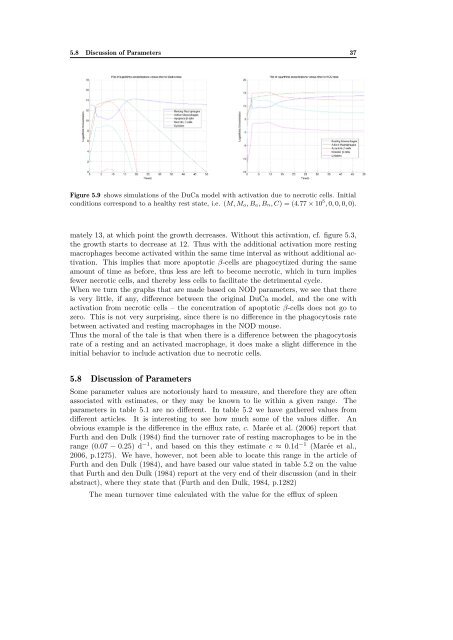
Figure 5.9 shows simulations of the DuCa model with activation due to necrotic cells. Initial<br />
conditions correspond to a healthy rest state, i.e. (M, Ma, Ba, Bn, C) = (4.77 × 10 5 , 0, 0, 0, 0).<br />
mately 13, at which point the growth decreases. Without this activation, cf. figure 5.3,<br />
the growth starts to decrease at 12. Thus with the additional activation more resting<br />
macrophages become activated within the same time interval as without additional activation.<br />
This implies that more apoptotic β-cells are phagocytized during the same<br />
amount of time as be<strong>for</strong>e, thus less are left to become necrotic, which in turn implies<br />
fewer necrotic cells, and thereby less cells to facilitate the detrimental cycle.<br />
When we turn the graphs that are made based on NOD parameters, we see that there<br />
is very little, if any, difference between the original DuCa model, and the one with<br />
activation from necrotic cells – the concentration of apoptotic β-cells does not go to<br />
zero. This is not very surprising, since there is no difference in the phagocytosis rate<br />
between activated and resting macrophages in the NOD mouse.<br />
Thus the moral of the tale is that when there is a difference between the phagocytosis<br />
rate of a resting and an activated macrophage, it does make a slight difference in the<br />
initial behavior to include activation due to necrotic cells.<br />
5.8 Discussion of Parameters<br />
Some parameter values are notoriously hard to measure, and there<strong>for</strong>e they are often<br />
associated with estimates, or they may be known to lie within a given range. The<br />
parameters in table 5.1 are no different. In table 5.2 we have gathered values from<br />
different articles. It is interesting to see how much some of the values differ. An<br />
obvious example is the difference in the efflux rate, c. Marée et al. (2006) report that<br />
Furth and den Dulk (1984) find the turnover rate of resting macrophages to be in the<br />
range (0.07 − 0.25) d −1 , and based on this they estimate c ≈ 0.1d −1 (Marée et al.,<br />
2006, p.1275). We have, however, not been able to locate this range in the article of<br />
Furth and den Dulk (1984), and have based our value stated in table 5.2 on the value<br />
that Furth and den Dulk (1984) report at the very end of their discussion (and in their<br />
abstract), where they state that (Furth and den Dulk, 1984, p.1282)<br />
The mean turnover time calculated with the value <strong>for</strong> the efflux of spleen