nr. 477 - 2011 - Institut for Natur, Systemer og Modeller (NSM)
nr. 477 - 2011 - Institut for Natur, Systemer og Modeller (NSM)
nr. 477 - 2011 - Institut for Natur, Systemer og Modeller (NSM)

You also want an ePaper? Increase the reach of your titles
YUMPU automatically turns print PDFs into web optimized ePapers that Google loves.
74 Bifurcation Diagrams and Analysis<br />
dimensional version of it, suggested by Marée et al. (2006), to see if making the QSS<br />
assumptions<br />
dBn<br />
dt<br />
dC<br />
dt<br />
= 0 (8.1)<br />
= 0 (8.2)<br />
has any influence on the behavior of the detected fixed points. This is interesting to<br />
determine, because it is, ceteris paribus, easier to analyze a three dimensional rather<br />
than a 5 dimensional system.<br />
8.2 Using f1 as the bifurcation parameter<br />
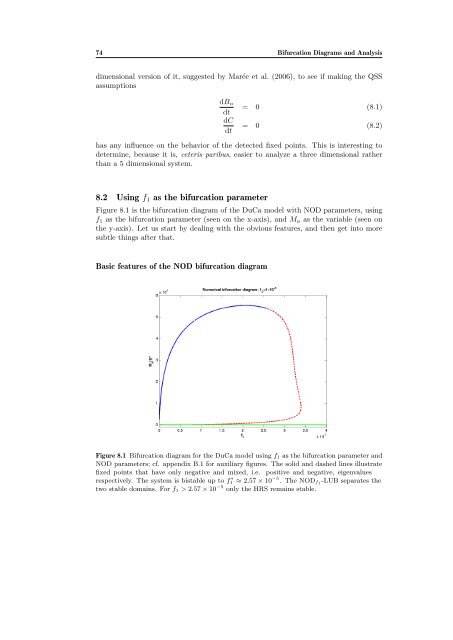
Figure 8.1 is the bifurcation diagram of the DuCa model with NOD parameters, using<br />
f1 as the bifurcation parameter (seen on the x-axis), and Ma as the variable (seen on<br />
the y-axis). Let us start by dealing with the obvious features, and then get into more<br />
subtle things after that.<br />
Basic features of the NOD bifurcation diagram<br />
Figure 8.1 Bifurcation diagram <strong>for</strong> the DuCa model using f1 as the bifurcation parameter and<br />
NOD parameters; cf. appendix B.1 <strong>for</strong> auxiliary figures. The solid and dashed lines illustrate<br />
fixed points that have only negative and mixed, i.e. positive and negative, eigenvalues<br />
respectively. The system is bistable up to f ∗ 1 ≈ 2.57 × 10 −5 . The NODf1-LUB separates the<br />
two stable domains. For f1 > 2.57 × 10 −5 only the HRS remains stable.