nr. 477 - 2011 - Institut for Natur, Systemer og Modeller (NSM)
nr. 477 - 2011 - Institut for Natur, Systemer og Modeller (NSM)
nr. 477 - 2011 - Institut for Natur, Systemer og Modeller (NSM)

Create successful ePaper yourself
Turn your PDF publications into a flip-book with our unique Google optimized e-Paper software.
8.2 Using f1 as the bifurcation parameter 85<br />
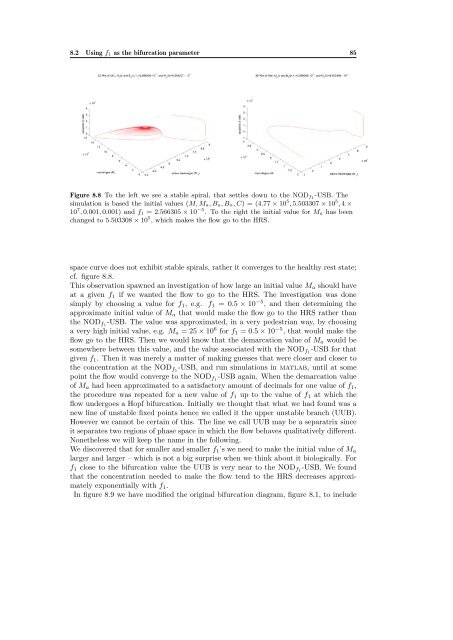
Figure 8.8 To the left we see a stable spiral, that settles down to the NODf1-USB. The<br />
simulation is based the initial values (M, Ma, Ba, Bn, C) = (4.77 × 10 5 , 5.503307 × 10 5 , 4 ×<br />
10 7 , 0.001, 0.001) and f1 = 2.566305 × 10 −5 . To the right the initial value <strong>for</strong> Ma has been<br />
changed to 5.503308 × 10 5 , which makes the flow go to the HRS.<br />
space curve does not exhibit stable spirals, rather it converges to the healthy rest state;<br />
cf. figure 8.8.<br />
This observation spawned an investigation of how large an initial value Ma should have<br />
at a given f1 if we wanted the flow to go to the HRS. The investigation was done<br />
simply by choosing a value <strong>for</strong> f1, e.g. f1 = 0.5 × 10 −5 , and then determining the<br />
approximate initial value of Ma that would make the flow go to the HRS rather than<br />
the NODf1-USB. The value was approximated, in a very pedestrian way, by choosing<br />
a very high initial value, e.g. Ma = 25 × 10 6 <strong>for</strong> f1 = 0.5 × 10 −5 , that would make the<br />
flow go to the HRS. Then we would know that the demarcation value of Ma would be<br />
somewhere between this value, and the value associated with the NODf1-USB <strong>for</strong> that<br />
given f1. Then it was merely a matter of making guesses that were closer and closer to<br />
the concentration at the NODf1-USB, and run simulations in matlab, until at some<br />
point the flow would converge to the NODf1-USB again. When the demarcation value<br />
of Ma had been approximated to a satisfactory amount of decimals <strong>for</strong> one value of f1,<br />
the procedure was repeated <strong>for</strong> a new value of f1 up to the value of f1 at which the<br />
flow undergoes a Hopf bifurcation. Initially we thought that what we had found was a<br />
new line of unstable fixed points hence we called it the upper unstable branch (UUB).<br />
However we cannot be certain of this. The line we call UUB may be a separatrix since<br />
it separates two regions of phase space in which the flow behaves qualitatively different.<br />
Nonetheless we will keep the name in the following.<br />
We discovered that <strong>for</strong> smaller and smaller f1’s we need to make the initial value of Ma<br />
larger and larger – which is not a big surprise when we think about it biol<strong>og</strong>ically. For<br />
f1 close to the bifurcation value the UUB is very near to the NODf1-USB. We found<br />
that the concentration needed to make the flow tend to the HRS decreases approximately<br />
exponentially with f1.<br />
In figure 8.9 we have modified the original bifurcation diagram, figure 8.1, to include