

Full Report - Center for Collaborative Education
Full Report - Center for Collaborative Education
Full Report - Center for Collaborative Education

You also want an ePaper? Increase the reach of your titles
YUMPU automatically turns print PDFs into web optimized ePapers that Google loves.
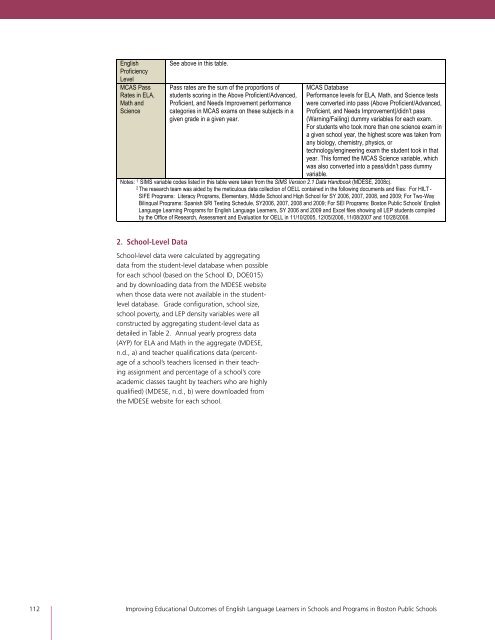
English<br />
Proficiency<br />
Level<br />
MCAS Pass<br />
Rates in ELA,<br />
Math and<br />
Science<br />
2. School-Level Data<br />
See above in this table.<br />
Pass rates are the sum of the proportions of<br />
students scoring in the Above Proficient/Advanced,<br />
Proficient, and Needs Improvement per<strong>for</strong>mance<br />
categories in MCAS exams on these subjects in a<br />
given grade in a given year.<br />
School-level data were calculated by aggregating<br />
data from the student-level database when possible<br />
<strong>for</strong> each school (based on the School ID, DOE015)<br />
and by downloading data from the MDESE website<br />
when those data were not available in the studentlevel<br />
database. Grade configuration, school size,<br />
school poverty, and LEP density variables were all<br />
constructed by aggregating student-level data as<br />
detailed in Table 2. Annual yearly progress data<br />
(AYP) <strong>for</strong> ELA and Math in the aggregate (MDESE,<br />
n.d., a) and teacher qualifications data (percentage<br />
of a school’s teachers licensed in their teaching<br />
assignment and percentage of a school’s core<br />
academic classes taught by teachers who are highly<br />
qualified) (MDESE, n.d., b) were downloaded from<br />
the MDESE website <strong>for</strong> each school.<br />
MCAS Database<br />
Per<strong>for</strong>mance levels <strong>for</strong> ELA, Math, and Science tests<br />
were converted into pass (Above Proficient/Advanced,<br />
Proficient, and Needs Improvement)/didn’t pass<br />
(Warning/Failing) dummy variables <strong>for</strong> each exam.<br />
For students who took more than one science exam in<br />
a given school year, the highest score was taken from<br />
any biology, chemistry, physics, or<br />
technology/engineering exam the student took in that<br />
year. This <strong>for</strong>med the MCAS Science variable, which<br />
was also converted into a pass/didn’t pass dummy<br />
variable.<br />
Notes: 1 SIMS variable codes listed in this table were taken from the SIMS Version 2.1 Data Handbook (MDESE, 2008c).<br />
2 The research team was aided by the meticulous data collection of OELL contained in the following documents and files: For HILT -<br />
SIFE Programs: Literacy Programs, Elementary, Middle School and High School <strong>for</strong> SY 2006, 2007, 2008, and 2009; For Two-Way<br />
Bilingual Programs: Spanish SRI Testing Schedule, SY2006, 2007, 2008 and 2009; For SEI Programs: Boston Public Schools’ English<br />
Language Learning Programs <strong>for</strong> English Language Learners, SY 2006 and 2009 and Excel files showing all LEP students compiled<br />
by the Office of Research, Assessment and Evaluation <strong>for</strong> OELL in 11/10/2005, 12/05/2006, 11/08/2007 and 10/28/2008.<br />
!<br />
112 Improving <strong>Education</strong>al Outcomes of English Language Learners in Schools and Programs in Boston Public Schools