

Full Report - Center for Collaborative Education
Full Report - Center for Collaborative Education
Full Report - Center for Collaborative Education

Create successful ePaper yourself
Turn your PDF publications into a flip-book with our unique Google optimized e-Paper software.
portions of core academic courses taught by highly<br />
qualified teachers than is prevalent in the district.<br />
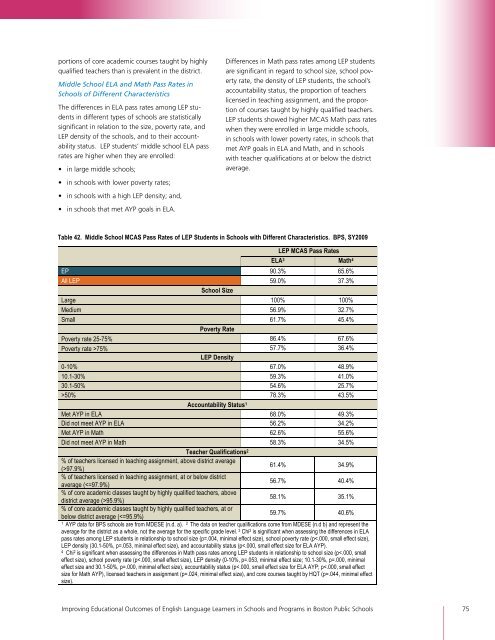
Middle School ELA and Math Pass Rates in<br />
Schools of Different Characteristics<br />
The differences in ELA pass rates among LEP students<br />
in different types of schools are statistically<br />
significant in relation to the size, poverty rate, and<br />
LEP density of the schools, and to their accountability<br />
status. LEP students’ middle school ELA pass<br />
rates are higher when they are enrolled:<br />
• in large middle schools;<br />
• in schools with lower poverty rates;<br />
• in schools with a high LEP density; and,<br />
! • in schools that met AYP goals in ELA.<br />
Differences in Math pass rates among LEP students<br />
are significant in regard to school size, school poverty<br />
rate, the density of LEP students, the school’s<br />
accountability status, the proportion of teachers<br />
licensed in teaching assignment, and the proportion<br />
of courses taught by highly qualified teachers.<br />
LEP students showed higher MCAS Math pass rates<br />
when they were enrolled in large middle schools,<br />
in schools with lower poverty rates, in schools that<br />
met AYP goals in ELA and Math, and in schools<br />
with teacher qualifications at or below the district<br />
average.<br />
Table 42. Middle School MCAS Pass Rates of LEP Students in Schools with Different Characteristics. BPS, SY2009<br />
LEP MCAS Pass Rates<br />
ELA3 Math4 EP 90.3% 65.6%<br />
All LEP 59.0% 37.3%<br />
School Size<br />
Large 100% 100%<br />
Medium 56.9% 32.7%<br />
Small 61.7% 45.4%<br />
Poverty Rate<br />
Poverty rate 25-75% 86.4% 67.6%<br />
Poverty rate >75% 57.7% 36.4%<br />
LEP Density<br />
0-10% 67.0% 48.9%<br />
10.1-30% 59.3% 41.0%<br />
30.1-50% 54.6% 25.7%<br />
>50% 78.3% 43.5%<br />
Accountability Status1 Met AYP in ELA 68.0% 49.3%<br />
Did not meet AYP in ELA 56.2% 34.2%<br />
Met AYP in Math 62.6% 55.6%<br />
Did not meet AYP in Math 58.3% 34.5%<br />
Teacher Qualifications2 % of teachers licensed in teaching assignment, above district average<br />
(>97.9%)<br />
61.4% 34.9%<br />
% of teachers licensed in teaching assignment, at or below district<br />
average (95.9%)<br />
58.1% 35.1%<br />
% of core academic classes taught by highly qualified teachers, at or<br />
below district average (