

Full Report - Center for Collaborative Education
Full Report - Center for Collaborative Education
Full Report - Center for Collaborative Education

Create successful ePaper yourself
Turn your PDF publications into a flip-book with our unique Google optimized e-Paper software.
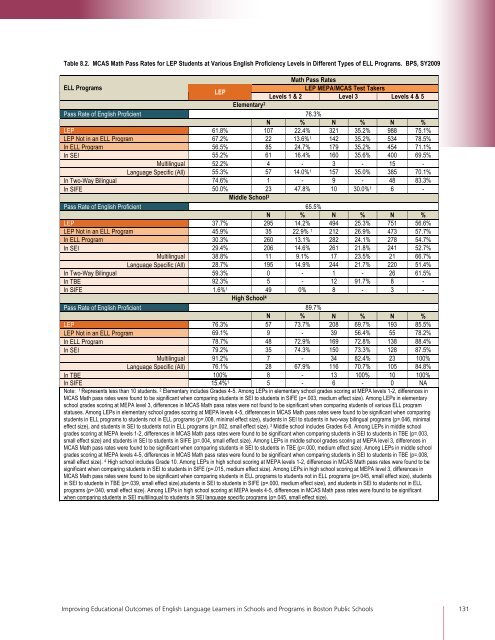
Table 8.2. MCAS Math Pass Rates <strong>for</strong> LEP Students at Various English Proficiency Levels in Different Types of ELL Programs. BPS, SY2009<br />
ELL Programs<br />
LEP<br />
Math Pass Rates<br />
LEP MEPA/MCAS Test Takers<br />
Levels 1 & 2 Level 3 Levels 4 & 5<br />
Elementary 2<br />
Pass Rate of English Proficient 76.3%<br />
N % N % N %<br />
LEP 61.8% 107 22.4% 321 35.2% 988 75.1%<br />
LEP Not in an ELL Program 67.2% 22 13.6% 1 142 35.2% 534 78.5%<br />
In ELL Program 56.5% 85 24.7% 179 35.2% 454 71.1%<br />
In SEI 55.2% 61 16.4% 160 35.6% 400 69.5%<br />
Multilingual 52.2% 4 - 3 - 15 -<br />
Language Specific (All) 55.3% 57 14.0% 1 157 35.0% 385 70.1%<br />
In Two-Way Bilingual 74.6% 1 - 9 - 48 83.3%<br />
In SIFE 50.0% 23 47.8% 10 30.0% 1 6 -<br />
Middle School 3<br />
Pass Rate of English Proficient 65.5%<br />
N % N % N %<br />
LEP 37.7% 295 14.2% 494 25.3% 751 56.6%<br />
LEP Not in an ELL Program 45.9% 35 22.9% 1 212 26.9% 473 57.7%<br />
In ELL Program 30.3% 260 13.1% 282 24.1% 278 54.7%<br />
In SEI 29.4% 206 14.6% 261 21.8% 241 52.7%<br />
Multilingual 38.8% 11 9.1% 17 23.5% 21 66.7%<br />
Language Specific (All) 28.7% 195 14.9% 244 21.7% 220 51.4%<br />
In Two-Way Bilingual 59.3% 0 - 1 - 26 61.5%<br />
In TBE 92.3% 5 - 12 91.7% 8 -<br />
In SIFE 1.6% 1 49 0% 8 - 3 -<br />
High School 4<br />
Pass Rate of English Proficient 89.7%<br />
N % N % N %<br />
LEP 76.3% 57 73.7% 208 69.7% 193 85.5%<br />
LEP Not in an ELL Program 69.1% 9 - 39 56.4% 55 78.2%<br />
In ELL Program 78.7% 48 72.9% 169 72.8% 138 88.4%<br />
In SEI 79.2% 35 74.3% 150 73.3% 128 87.5%<br />
Multilingual 91.2% 7 - 34 82.4% 23 100%<br />
Language Specific (All) 76.1% 28 67.9% 116 70.7% 105 84.8%<br />
In TBE 100% 8 - 13 100% 10 100%<br />
In SIFE 15.4% 1 5 - 6 - 0 NA<br />
Note: 1 Represents less than 10 students. 2 Elementary includes Grades 4-5. Among LEPs in elementary school grades scoring at MEPA levels 1-2, differences in<br />
MCAS Math pass rates were found to be significant when comparing students in SEI to students in SIFE (p=.003, medium effect size). Among LEPs in elementary<br />
school grades scoring at MEPA level 3, differences in MCAS Math pass rates were not found to be significant when comparing students of various ELL program<br />
statuses. Among LEPs in elementary school grades scoring at MEPA levels 4-5, differences in MCAS Math pass rates were found to be significant when comparing<br />
students in ELL programs to students not in ELL programs (p=.008, minimal effect size), students in SEI to students in two-way bilingual programs (p=.046, minimal<br />
effect size), and students in SEI to students not in ELL programs (p=.002, small effect size). 3 Middle school includes Grades 6-8. Among LEPs in middle school<br />
grades scoring at MEPA levels 1-2, differences in MCAS Math pass rates were found to be significant when comparing students in SEI to students in TBE (p=.003,<br />
small effect size) and students in SEI to students in SIFE (p=.004, small effect size). Among LEPs in middle school grades scoring at MEPA level 3, differences in<br />
MCAS Math pass rates were found to be significant when comparing students in SEI to students in TBE (p=.000, medium effect size). Among LEPs in middle school<br />
grades scoring at MEPA levels 4-5, differences in MCAS Math pass rates were found to be significant when comparing students in SEI to students in TBE (p=.008,<br />
small effect size). 4 High school includes Grade 10. Among LEPs in high school scoring at MEPA levels 1-2, differences in MCAS Math pass rates were found to be<br />
significant when comparing students in SEI to students in SIFE (p=.015, medium effect size). Among LEPs in high school scoring at MEPA level 3, differences in<br />
MCAS Math pass rates were found to be significant when comparing students in ELL programs to students not in ELL programs (p=.045, small effect size), students<br />
in SEI to students in TBE (p=.039, small effect size),students in SEI to students in SIFE (p=.000, medium effect size), and students in SEI to students not in ELL<br />
programs (p=.040, small effect size). Among LEPs in high school scoring at MEPA levels 4-5, differences in MCAS Math pass rates were found to be significant<br />
when comparing students in SEI multilingual to students in SEI language specific programs (p=.045, small effect size).<br />
!<br />
Improving <strong>Education</strong>al Outcomes of English Language Learners in Schools and Programs in Boston Public Schools 131