

Full Report - Center for Collaborative Education
Full Report - Center for Collaborative Education
Full Report - Center for Collaborative Education

You also want an ePaper? Increase the reach of your titles
YUMPU automatically turns print PDFs into web optimized ePapers that Google loves.
Populations focused upon in this and<br />
subsequent chapters:<br />
Total All BPS<br />
Native<br />
Language<br />
Native English Speaker (NES)<br />
Native Speakers of Other Languages<br />
(NSOL)<br />
Language<br />
Proficiency<br />
English Proficient (EP)<br />
NES<br />
NSOL-<br />
EP<br />
FLEP<br />
Limited<br />
English<br />
Proficiency (LEP)<br />
Program<br />
Participation<br />
Not in ELL Program<br />
Not in<br />
ELL<br />
Prog<br />
In<br />
ELL Prog<br />
A How Are English Proficiency<br />
Levels Distributed Across<br />
English Language Learners?<br />
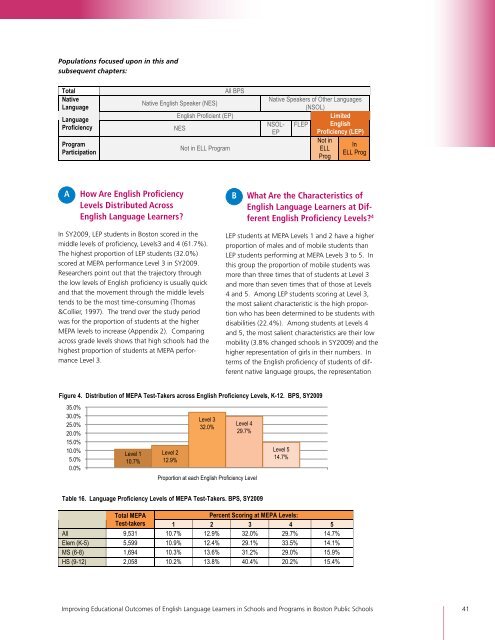
In SY2009, LEP students in Boston scored in the<br />
middle levels of proficiency, Levels3 and 4 (61.7%).<br />
The highest proportion of LEP students (32.0%)<br />
scored at MEPA per<strong>for</strong>mance Level 3 in SY2009.<br />
Researchers point out that the trajectory through<br />
the low levels of English proficiency is usually quick<br />
and that the movement through the middle levels<br />
tends to be the most time-consuming (Thomas<br />
&Collier, 1997). The trend over the study period<br />
was <strong>for</strong> the proportion of students at the higher<br />
MEPA levels to increase (Appendix 2). Comparing<br />
across grade levels shows that high schools had the<br />
highest proportion of students at MEPA per<strong>for</strong>mance<br />
Level 3.<br />
B What Are the Characteristics of<br />
English Language Learners at Different<br />
English Proficiency Levels? 4<br />
LEP students at MEPA Levels 1 and 2 have a higher<br />
proportion of males and of mobile students than<br />
LEP students per<strong>for</strong>ming at MEPA Levels 3 to 5. In<br />
this group the proportion of mobile students was<br />
more than three times that of students at Level 3<br />
and more than seven times that of those at Levels<br />
4 and 5. Among LEP students scoring at Level 3,<br />
the most salient characteristic is the high proportion<br />
who has been determined to be students with<br />
disabilities (22.4%). Among students at Levels 4<br />
and 5, the most salient characteristics are their low<br />
mobility (3.8% changed schools in SY2009) and the<br />
higher representation of girls in their numbers. In<br />
terms of the English proficiency of students of different<br />
native language groups, the representation<br />
Figure 4. Distribution of MEPA Test-Takers across English Proficiency Levels, K-12. BPS, SY2009<br />
35.0%<br />
30.0%<br />
25.0%<br />
20.0%<br />
15.0%<br />
10.0%<br />
5.0%<br />
0.0%<br />
Level 1<br />
10.7%<br />
Level 2<br />
12.9%<br />
Level 3<br />
32.0%<br />
Level 4<br />
29.7%<br />
Proportion at each English Proficiency Level<br />
Table 16. Language Proficiency Levels of MEPA Test-Takers. BPS, SY2009<br />
Improving <strong>Education</strong>al Outcomes of English Language Learners in Schools and Programs in Boston Public Schools 41<br />
Level 5<br />
14.7%<br />
Total MEPA<br />
Percent Scoring at MEPA Levels:<br />
Test-takers 1 2 3 4 5<br />
All 9,531 10.7% 12.9% 32.0% 29.7% 14.7%<br />
Elem (K-5) 5,599 10.9% 12.4% 29.1% 33.5% 14.1%<br />
MS (6-8) 1,694 10.3% 13.6% 31.2% 29.0% 15.9%<br />
HS (9-12) 2,058 10.2% 13.8% 40.4% 20.2% 15.4%