

Full Report - Center for Collaborative Education
Full Report - Center for Collaborative Education
Full Report - Center for Collaborative Education

You also want an ePaper? Increase the reach of your titles
YUMPU automatically turns print PDFs into web optimized ePapers that Google loves.
C What Are the ELA and Math<br />
Pass Rates of English Language<br />
Learners in Schools with<br />
Different Characteristics?<br />
Elementary MCAS ELA and Math Pass Rates in<br />
Schools with Different Characteristics<br />
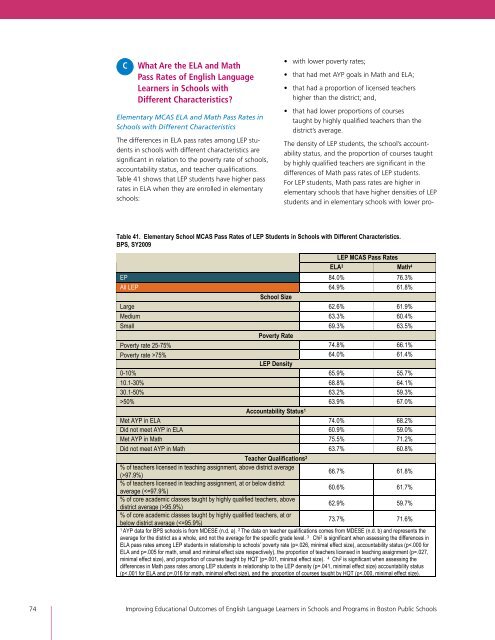
The differences in ELA pass rates among LEP students<br />
in schools with different characteristics are<br />
significant in relation to the poverty rate of schools,<br />
accountability status, and teacher qualifications.<br />
Table 41 shows that LEP students have higher pass<br />
rates in ELA when they are enrolled in elementary<br />
schools:<br />
• with lower poverty rates;<br />
• that had met AYP goals in Math and ELA;<br />
• that had a proportion of licensed teachers<br />
higher than the district; and,<br />
• that had lower proportions of courses<br />
taught by highly qualified teachers than the<br />
district’s average.<br />
The density of LEP students, the school’s accountability<br />
status, and the proportion of courses taught<br />
by highly qualified teachers are significant in the<br />
differences of Math pass rates of LEP students.<br />
For LEP students, Math pass rates are higher in<br />
elementary schools that have higher densities of LEP<br />
students and in elementary schools with lower pro-<br />
Table 41. Elementary School MCAS Pass Rates of LEP Students in Schools with Different Characteristics.<br />
BPS, SY2009<br />
LEP MCAS Pass Rates<br />
ELA3 Math4 EP 84.0% 76.3%<br />
All LEP 64.9% 61.8%<br />
School Size<br />
Large 62.6% 61.9%<br />
Medium 63.3% 60.4%<br />
Small 69.3% 63.5%<br />
Poverty Rate<br />
Poverty rate 25-75% 74.8% 66.1%<br />
Poverty rate >75% 64.0% 61.4%<br />
LEP Density<br />
0-10% 65.9% 55.7%<br />
10.1-30% 68.8% 64.1%<br />
30.1-50% 63.2% 59.3%<br />
>50% 63.9% 67.0%<br />
Accountability Status1 Met AYP in ELA 74.0% 68.2%<br />
Did not meet AYP in ELA 60.9% 59.0%<br />
Met AYP in Math 75.5% 71.2%<br />
Did not meet AYP in Math 63.7% 60.8%<br />
Teacher Qualifications2 % of teachers licensed in teaching assignment, above district average<br />
(>97.9%)<br />
66.7% 61.8%<br />
% of teachers licensed in teaching assignment, at or below district<br />
average (95.9%)<br />
62.9% 59.7%<br />
% of core academic classes taught by highly qualified teachers, at or<br />
below district average (