

Full Report - Center for Collaborative Education
Full Report - Center for Collaborative Education
Full Report - Center for Collaborative Education

Create successful ePaper yourself
Turn your PDF publications into a flip-book with our unique Google optimized e-Paper software.
!<br />
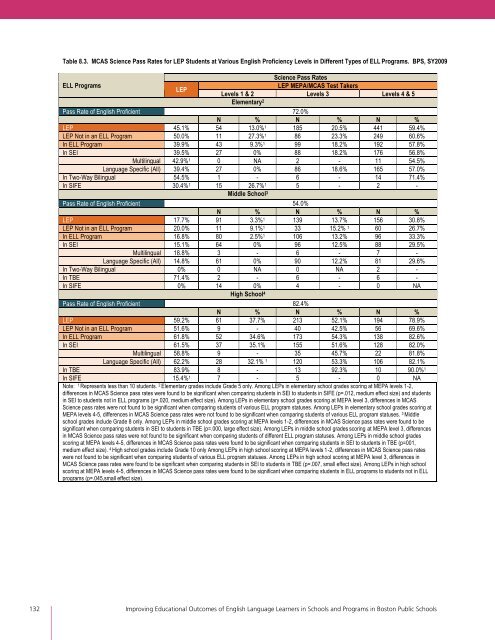
Table 8.3. MCAS Science Pass Rates <strong>for</strong> LEP Students at Various English Proficiency Levels in Different Types of ELL Programs. BPS, SY2009<br />
ELL Programs<br />
LEP<br />
Levels 1 & 2<br />
Elementary<br />
Science Pass Rates<br />
LEP MEPA/MCAS Test Takers<br />
Levels 3 Levels 4 & 5<br />
2<br />
Pass Rate of English Proficient 72.0%<br />
N % N % N %<br />
LEP 45.1% 54 13.0% 1 185 20.5% 441 59.4%<br />
LEP Not in an ELL Program 50.0% 11 27.3% 1 86 23.3% 249 60.6%<br />
In ELL Program 39.9% 43 9.3% 1 99 18.2% 192 57.8%<br />
In SEI 39.5% 27 0% 88 18.2% 176 56.8%<br />
Multilingual 42.9% 1 0 NA 2 - 11 54.5%<br />
Language Specific (All) 39.4% 27 0% 86 18.6% 165 57.0%<br />
In Two-Way Bilingual 54.5% 1 - 6 - 14 71.4%<br />
In SIFE 30.4% 1 15 26.7% 1 Middle School<br />
5 - 2 -<br />
3<br />
Pass Rate of English Proficient 54.0%<br />
N % N % N %<br />
LEP 17.7% 91 3.3% 1 139 13.7% 156 30.8%<br />
LEP Not in an ELL Program 20.0% 11 9.1% 1 33 15.2% 1 60 26.7%<br />
In ELL Program 16.8% 80 2.5% 1 106 13.2% 96 33.3%<br />
In SEI 15.1% 64 0% 96 12.5% 88 29.5%<br />
Multilingual 18.8% 3 - 6 - 7 -<br />
Language Specific (All) 14.8% 61 0% 90 12.2% 81 29.6%<br />
In Two-Way Bilingual 0% 0 NA 0 NA 2 -<br />
In TBE 71.4% 2 - 6 - 6 -<br />
In SIFE 0% 14 0% 4 - 0 NA<br />
High School 4<br />
Pass Rate of English Proficient 82.4%<br />
N % N % N %<br />
LEP 59.2% 61 37.7% 213 52.1% 194 78.9%<br />
LEP Not in an ELL Program 51.6% 9 - 40 42.5% 56 69.6%<br />
In ELL Program 61.8% 52 34.6% 173 54.3% 138 82.6%<br />
In SEI 61.5% 37 35.1% 155 51.6% 128 82.0%<br />
Multilingual 58.8% 9 - 35 45.7% 22 81.8%<br />
Language Specific (All) 62.2% 28 32.1% 1 120 53.3% 106 82.1%<br />
In TBE 83.9% 8 - 13 92.3% 10 90.0% 1<br />
In SIFE 15.4% 1 7 - 5 - 0 NA<br />
Note: 1 Represents less than 10 students. 2 Elementary grades include Grade 5 only. Among LEPs in elementary school grades scoring at MEPA levels 1-2,<br />
differences in MCAS Science pass rates were found to be significant when comparing students in SEI to students in SIFE (p=.012, medium effect size) and students<br />
in SEI to students not in ELL programs (p=.020, medium effect size). Among LEPs in elementary school grades scoring at MEPA level 3, differences in MCAS<br />
Science pass rates were not found to be significant when comparing students of various ELL program statuses. Among LEPs in elementary school grades scoring at<br />
MEPA levels 4-5, differences in MCAS Science pass rates were not found to be significant when comparing students of various ELL program statuses. 3 Middle<br />
school grades include Grade 8 only. Among LEPs in middle school grades scoring at MEPA levels 1-2, differences in MCAS Science pass rates were found to be<br />
significant when comparing students in SEI to students in TBE (p=.000, large effect size). Among LEPs in middle school grades scoring at MEPA level 3, differences<br />
in MCAS Science pass rates were not found to be significant when comparing students of different ELL program statuses. Among LEPs in middle school grades<br />
scoring at MEPA levels 4-5, differences in MCAS Science pass rates were found to be significant when comparing students in SEI to students in TBE (p=001,<br />
medium effect size). 4 High school grades include Grade 10 only Among LEPs in high school scoring at MEPA levels 1-2, differences in MCAS Science pass rates<br />
were not found to be significant when comparing students of various ELL program statuses. Among LEPs in high school scoring at MEPA level 3, differences in<br />
MCAS Science pass rates were found to be significant when comparing students in SEI to students in TBE (p=.007, small effect size). Among LEPs in high school<br />
scoring at MEPA levels 4-5, differences in MCAS Science pass rates were found to be significant when comparing students in ELL programs to students not in ELL<br />
programs (p=.045,small effect size).<br />
!<br />
132 Improving <strong>Education</strong>al Outcomes of English Language Learners in Schools and Programs in Boston Public Schools