

Full Report - Center for Collaborative Education
Full Report - Center for Collaborative Education
Full Report - Center for Collaborative Education

Create successful ePaper yourself
Turn your PDF publications into a flip-book with our unique Google optimized e-Paper software.
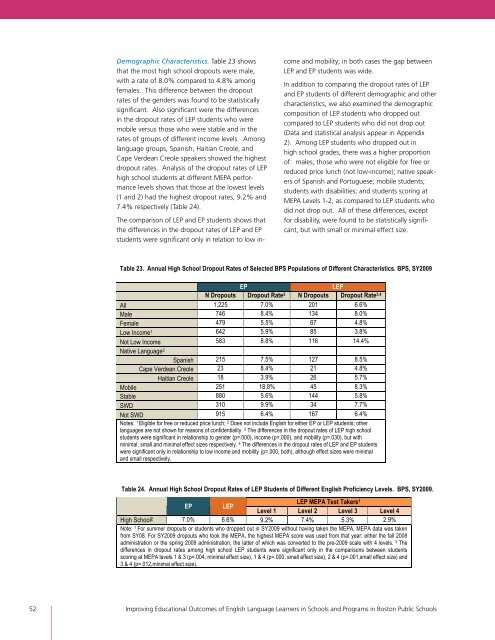
Demographic Characteristics. Table 23 shows<br />
that the most high school dropouts were male,<br />
with a rate of 8.0% compared to 4.8% among<br />
females. This difference between the dropout<br />
rates of the genders was found to be statistically<br />
significant. Also significant were the differences<br />
in the dropout rates of LEP students who were<br />
mobile versus those who were stable and in the<br />
rates of groups of different income levels. Among<br />
language groups, Spanish, Haitian Creole, and<br />
Cape Verdean Creole speakers showed the highest<br />
dropout rates. Analysis of the dropout rates of LEP<br />
high school students at different MEPA per<strong>for</strong>mance<br />
levels shows that those at the lowest levels<br />
(1 and 2) had the highest dropout rates, 9.2% and<br />
7.4% respectively (Table 24).<br />
The comparison of LEP and EP students shows that<br />
the differences in the dropout rates of LEP and EP<br />
students were significant only in relation to low in-<br />
come and mobility; in both cases the gap between<br />
LEP and EP students was wide.<br />
In addition to comparing the dropout rates of LEP<br />
and EP students of different demographic and other<br />
characteristics, we also examined the demographic<br />
composition of LEP students who dropped out<br />
compared to LEP students who did not drop out<br />
(Data and statistical analysis appear in Appendix<br />
2). Among LEP students who dropped out in<br />
high school grades, there was a higher proportion<br />
of: males; those who were not eligible <strong>for</strong> free or<br />
reduced price lunch (not low-income); native speakers<br />
of Spanish and Portuguese; mobile students;<br />
students with disabilities; and students scoring at<br />
MEPA Levels 1-2, as compared to LEP students who<br />
did not drop out. All of these differences, except<br />
<strong>for</strong> disability, were found to be statistically significant,<br />
but with small or minimal effect size.<br />
Table 23. Annual High School Dropout Rates of Selected BPS Populations of Different Characteristics. BPS, SY2009<br />
EP LEP<br />
N Dropouts Dropout Rate3 N Dropouts Dropout Rate3,4 All 1,225 7.0% 201 6.6%<br />
Male 746 8.4% 134 8.0%<br />
Female 479 5.5% 67 4.8%<br />
Low Income1 642 5.9% 85 3.8%<br />
Not Low Income<br />
Native Language<br />
583 8.8% 116 14.4%<br />
2<br />
Spanish 215 7.5% 127 8.5%<br />
Cape Verdean Creole 23 8.4% 21 4.8%<br />
Haitian Creole 18 3.9% 26 5.7%<br />
Mobile 251 18.8% 45 8.3%<br />
Stable 880 5.6% 144 5.8%<br />
SWD 310 9.9% 34 7.7%<br />
Not SWD 915 6.4% 167 6.4%<br />
Notes: 1 Eligible <strong>for</strong> free or reduced price lunch; 2 Does not include English <strong>for</strong> either EP or LEP students; other<br />
languages are not shown <strong>for</strong> reasons of confidentiality. 3 The differences in the dropout rates of LEP high school<br />
students were significant in relationship to gender (p=.000), income (p=.000), and mobility (p=.030), but with<br />
minimal, small and minimal effect sizes respectively. 4 The differences in the dropout rates of LEP and EP students<br />
were significant only in relationship to low income and mobility (p=.000, both), although effect sizes were minimal<br />
and small respectively.<br />
Table 24. Annual High School Dropout Rates of LEP Students of Different English Proficiency Levels. BPS, SY2009.<br />
LEP MEPA Test Takers1 EP LEP<br />
Level 1 Level 2 Level 3 Level 4<br />
High School2 7.0% 6.6% 9.2% 7.4% 5.3% 2.9%<br />
Note: 1 For summer dropouts or students who dropped out in SY2009 without having taken the MEPA, MEPA data was taken<br />
from SY08. For SY2009 dropouts who took the MEPA, the highest MEPA score was used from that year: either the fall 2008<br />
administration or the spring 2009 administration, the latter of which was converted to the pre-2009 scale with 4 levels. 2 The<br />
differences in dropout rates among high school LEP students were significant only in the comparisons between students<br />
scoring at MEPA levels 1 & 3 (p=.004, minimal effect size), 1 & 4 (p=.000, small effect size), 2 & 4 (p=.001,small effect size) and<br />
3 & 4 (p=.012,minimal effect size).<br />
52 Improving <strong>Education</strong>al Outcomes of English Language Learners in Schools and Programs in Boston Public Schools