

Full Report - Center for Collaborative Education
Full Report - Center for Collaborative Education
Full Report - Center for Collaborative Education

Create successful ePaper yourself
Turn your PDF publications into a flip-book with our unique Google optimized e-Paper software.
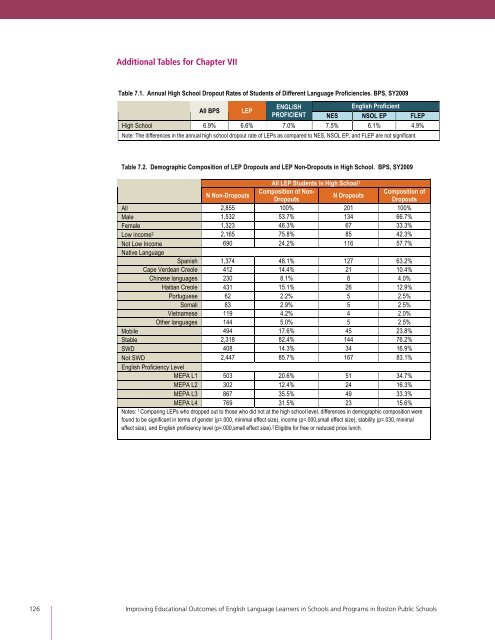
Additional ! Tables <strong>for</strong> Chapter VII<br />
&<br />
Table 7.1. Annual High School Dropout Rates of Students of Different Language Proficiencies. BPS, SY2009<br />
All BPS LEP<br />
ENGLISH<br />
PROFICIENT NES<br />
English Proficient<br />
NSOL EP FLEP<br />
High School 6.9% 6.6% 7.0% 7.5% 6.1% 4.9%<br />
! Note: The differences in the annual high school dropout rate of LEPs as compared to NES, NSOL EP, and FLEP are not significant.<br />
!<br />
Table 7.2. Demographic Composition of LEP Dropouts and LEP Non-Dropouts in High School. BPS, SY2009<br />
All LEP Students in High School1 N Non-Dropouts<br />
Composition of Non-<br />
Dropouts<br />
N Dropouts<br />
Composition of<br />
Dropouts<br />
All 2,855 100% 201 100%<br />
Male 1,532 53.7% 134 66.7%<br />
Female 1,323 46.3% 67 33.3%<br />
Low income2 2,165 75.8% 85 42.3%<br />
Not Low Income<br />
Native Language<br />
690 24.2% 116 57.7%<br />
Spanish 1,374 48.1% 127 63.2%<br />
Cape Verdean Creole 412 14.4% 21 10.4%<br />
Chinese languages 230 8.1% 8 4.0%<br />
Haitian Creole 431 15.1% 26 12.9%<br />
Portuguese 62 2.2% 5 2.5%<br />
Somali 83 2.9% 5 2.5%<br />
Vietnamese 119 4.2% 4 2.0%<br />
Other languages 144 5.0% 5 2.5%<br />
Mobile 494 17.6% 45 23.8%<br />
Stable 2,318 82.4% 144 76.2%<br />
SWD 408 14.3% 34 16.9%<br />
Not SWD<br />
English Proficiency Level<br />
2,447 85.7% 167 83.1%<br />
MEPA L1 503 20.6% 51 34.7%<br />
MEPA L2 302 12.4% 24 16.3%<br />
MEPA L3 867 35.5% 49 33.3%<br />
MEPA L4 769 31.5% 23 15.6%<br />
Notes: 1 Comparing LEPs who dropped out to those who did not at the high school level, differences in demographic composition were<br />
found to be significant in terms of gender (p=.000, minimal effect size), income (p=.000,small effect size), stability (p=.030, minimal<br />
effect size), and English proficiency level (p=.000,small effect size). 2 Eligible <strong>for</strong> free or reduced price lunch.<br />
126 Improving <strong>Education</strong>al Outcomes of English Language Learners in Schools and Programs in Boston Public Schools<br />
!<br />
!