

Full Report - Center for Collaborative Education
Full Report - Center for Collaborative Education
Full Report - Center for Collaborative Education

Create successful ePaper yourself
Turn your PDF publications into a flip-book with our unique Google optimized e-Paper software.
!<br />
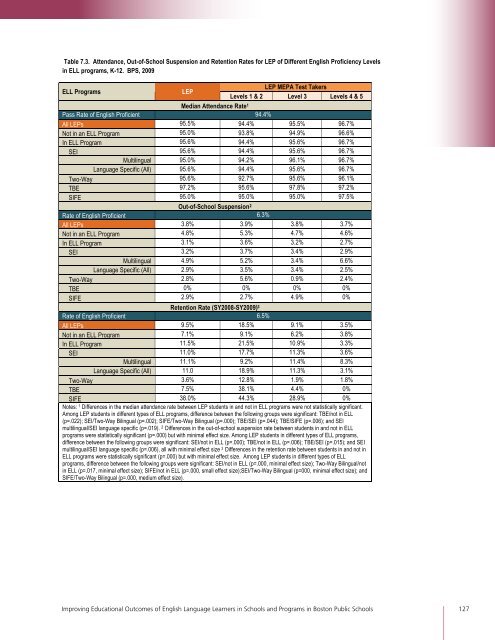
Table 7.3. Attendance, Out-of-School Suspension and Retention Rates <strong>for</strong> LEP of Different English Proficiency Levels<br />
in ELL programs, K-12. BPS, 2009<br />
ELL Programs LEP<br />
Levels 1 & 2<br />
LEP MEPA Test Takers<br />
Level 3 Levels 4 & 5<br />
Median Attendance Rate1 Pass Rate of English Proficient 94.4%<br />
All LEPs 95.5% 94.4% 95.5% 96.7%<br />
Not in an ELL Program 95.0% 93.8% 94.9% 96.6%<br />
In ELL Program 95.6% 94.4% 95.6% 96.7%<br />
SEI 95.6% 94.4% 95.6% 96.7%<br />
Multilingual 95.0% 94.2% 96.1% 96.7%<br />
Language Specific (All) 95.6% 94.4% 95.6% 96.7%<br />
Two-Way 95.6% 92.7% 95.6% 96.1%<br />
TBE 97.2% 95.6% 97.8% 97.2%<br />
SIFE 95.0% 95.0% 95.0% 97.5%<br />
Out-of-School Suspension2 Rate of English Proficient<br />
6.3%<br />
All LEPs 3.8% 3.9% 3.8% 3.7%<br />
Not in an ELL Program 4.8% 5.3% 4.7% 4.6%<br />
In ELL Program 3.1% 3.6% 3.2% 2.7%<br />
SEI 3.2% 3.7% 3.4% 2.9%<br />
Multilingual 4.9% 5.2% 3.4% 6.6%<br />
Language Specific (All) 2.9% 3.5% 3.4% 2.5%<br />
Two-Way 2.8% 5.6% 0.9% 2.4%<br />
TBE 0% 0% 0% 0%<br />
SIFE 2.9% 2.7% 4.9% 0%<br />
Retention Rate (SY2008-SY2009) 3<br />
Rate of English Proficient 6.5%<br />
All LEPs 9.5% 18.5% 9.1% 3.5%<br />
Not in an ELL Program 7.1% 9.1% 6.2% 3.8%<br />
In ELL Program 11.5% 21.5% 10.9% 3.3%<br />
SEI 11.0% 17.7% 11.3% 3.6%<br />
Multilingual 11.1% 9.2% 11.4% 8.3%<br />
Language Specific (All) 11.0 18.9% 11.3% 3.1%<br />
Two-Way 3.6% 12.8% 1.9% 1.8%<br />
TBE 7.5% 38.1% 4.4% 0%<br />
SIFE 38.0% 44.3% 28.9% 0%<br />
Notes: 1 Differences in the median attendance rate between LEP students in and not in ELL programs were not statistically significant.<br />
Among LEP students in different types of ELL programs, difference between the following groups were significant: TBE/not in ELL<br />
(p=.022); SEI/Two-Way Bilingual (p=.002); SIFE/Two-Way Bilingual (p=.000); TBE/SEI (p=.044); TBE/SIFE (p=.006); and SEI<br />
multilingual/SEI language specific (p=.019). 2 Differences in the out-of-school suspension rate between students in and not in ELL<br />
programs were statistically significant (p=.000) but with minimal effect size. Among LEP students in different types of ELL programs,<br />
difference between the following groups were significant: SEI/not in ELL (p=.000); TBE/not in ELL (p=.006); TBE/SEI (p=.015); and SEI<br />
multilingual/SEI language specific (p=.006), all with minimal effect size 3 Differences in the retention rate between students in and not in<br />
ELL programs were statistically significant (p=.000) but with minimal effect size. Among LEP students in different types of ELL<br />
programs, difference between the following groups were significant: SEI/not in ELL (p=.000, minimal effect size); Two-Way Bilingual/not<br />
in ELL (p=.017, minimal effect size); SIFE/not in ELL (p=.000, small effect size);SEI/Two-Way Bilingual (p=000, minimal effect size); and<br />
SIFE/Two-Way Bilingual (p=.000, medium effect size).<br />
Improving <strong>Education</strong>al Outcomes of English Language Learners in Schools and Programs in Boston Public Schools 127