

Full Report - Center for Collaborative Education
Full Report - Center for Collaborative Education
Full Report - Center for Collaborative Education

Create successful ePaper yourself
Turn your PDF publications into a flip-book with our unique Google optimized e-Paper software.
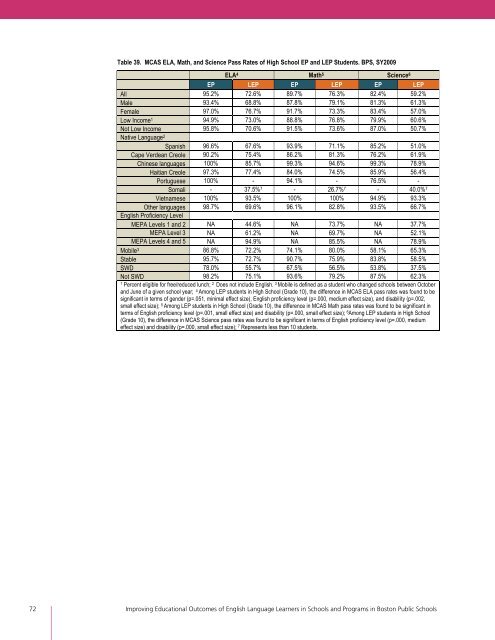
Table 39. MCAS ELA, Math, and Science Pass Rates of High School EP and LEP Students. BPS, SY2009<br />
ELA 4 Math 5 Science 6<br />
EP LEP EP LEP EP LEP<br />
All 95.2% 72.6% 89.7% 76.3% 82.4% 59.2%<br />
Male 93.4% 68.8% 87.8% 79.1% 81.3% 61.3%<br />
Female 97.0% 76.7% 91.7% 73.3% 83.4% 57.0%<br />
Low Income 1 94.9% 73.0% 88.8% 76.8% 79.9% 60.6%<br />
Not Low Income 95.8% 70.6% 91.5% 73.6% 87.0% 50.7%<br />
Native Language 2<br />
Spanish 96.6% 67.6% 93.9% 71.1% 85.2% 51.0%<br />
Cape Verdean Creole 90.2% 75.4% 86.2% 81.3% 76.2% 61.9%<br />
Chinese languages 100% 85.7% 99.3% 94.6% 99.3% 78.9%<br />
Haitian Creole 97.3% 77.4% 84.0% 74.5% 85.9% 56.4%<br />
Portuguese 100% - 94.1% - 76.5% -<br />
Somali - 37.5% 7 - 26.7% 7 - 40.0% 7<br />
Vietnamese 100% 93.5% 100% 100% 94.9% 93.3%<br />
Other languages 98.7% 69.6% 96.1% 82.8% 93.5% 66.7%<br />
English Proficiency Level<br />
MEPA Levels 1 and 2 NA 44.6% NA 73.7% NA 37.7%<br />
MEPA Level 3 NA 61.2% NA 69.7% NA 52.1%<br />
MEPA Levels 4 and 5 NA 94.9% NA 85.5% NA 78.9%<br />
Mobile 3 86.8% 72.2% 74.1% 80.0% 58.1% 65.3%<br />
Stable 95.7% 72.7% 90.7% 75.9% 83.8% 58.5%<br />
SWD 78.0% 55.7% 67.5% 56.5% 53.8% 37.5%<br />
Not SWD 98.2% 75.1% 93.6% 79.2% 87.5% 62.3%<br />
1 Percent eligible <strong>for</strong> free/reduced lunch; 2 Does not include English. 3 Mobile is defined as a student who changed schools between October<br />
and June of a given school year; 4 Among LEP students in High School (Grade 10), the difference in MCAS ELA pass rates was found to be<br />
significant in terms of gender (p=.051, minimal effect size), English proficiency level (p=.000, medium effect size), and disability (p=.002,<br />
small effect size); 5 Among LEP students in High School (Grade 10), the difference in MCAS Math pass rates was found to be significant in<br />
terms of English proficiency level (p=.001, small effect size) and disability (p=.000, small effect size); 6 Among LEP students in High School<br />
(Grade 10), the difference in MCAS Science pass rates was found to be significant in terms of English proficiency level (p=.000, medium<br />
effect size) and disability (p=.000, small effect size); 7 Represents less than 10 students.<br />
72 Improving <strong>Education</strong>al Outcomes of English Language Learners in Schools and Programs in Boston Public Schools