- Page 1 and 2:
Center for Collaborative Education
- Page 3 and 4:
This report, Improving Educational
- Page 5 and 6:
VII. DROPPING OUT 48 A. What Are th
- Page 7 and 8:
CHAPTER I. INTRODUCTION
- Page 9 and 10:
Language Learners (OELL) has attemp
- Page 11 and 12:
CHAPTER II. THE STUDY
- Page 13 and 14:
epresented by the blocks in differe
- Page 15 and 16:
Table 2. Variables, Definitions, an
- Page 17 and 18:
CHAPTER III. ENROLLMENT AND CHARACT
- Page 19 and 20:
Figure 1. Change in Enrollment of S
- Page 21 and 22:
Native speakers of Haitian Creole a
- Page 23 and 24:
In Sum Following a swift decline in
- Page 25 and 26:
One of the foci of this study is th
- Page 27 and 28:
School Poverty Rate. Income status
- Page 29 and 30:
ed a significantly smaller proporti
- Page 31 and 32:
In Sum In this chapter we focused o
- Page 33 and 34:
One of the deepest and most far-rea
- Page 35 and 36:
the transfer of large numbers of LE
- Page 37 and 38:
education. There are no studies of
- Page 39 and 40:
IN DEPTH: Enrollment of English Lan
- Page 41 and 42:
Table 14. Nature of Primary Disabil
- Page 43 and 44:
choices. From the data gathered, it
- Page 45 and 46:
Becoming fully literate in English,
- Page 47 and 48:
Populations focused upon in this an
- Page 49 and 50:
Table 19. English Proficiency Level
- Page 51 and 52:
who attained the level of English p
- Page 53 and 54:
ed among those LEP students scoring
- Page 55 and 56:
High dropout rates among Boston Pub
- Page 57 and 58:
B What Is the Annual High School Dr
- Page 59 and 60:
C What Are the Rates of Attendance,
- Page 61 and 62:
Table 26. Median Attendance Rates o
- Page 63 and 64:
Table 29. Attendance, Out-of-School
- Page 65 and 66:
Table 31. Annual High School Dropou
- Page 67 and 68:
In Sum This chapter has focused on
- Page 69 and 70:
The tests of the Massachusetts Comp
- Page 71 and 72:
student achievement (Rumberger, 199
- Page 73 and 74:
Table 34. MCAS Math Pass Rates of S
- Page 75 and 76:
Table 36. MCAS ELA, Math, and Scien
- Page 77 and 78:
Pass Rates in MCAS ELA, Math, and S
- Page 79 and 80:
IN DEPTH: Attendance Rates of MCAS
- Page 81 and 82:
portions of core academic courses t
- Page 83 and 84: D What are the MCAS ELA and Math Pa
- Page 85 and 86: LEP Students at MEPA Performance Le
- Page 87 and 88: school that they attend; if student
- Page 89 and 90: Results: English Language Arts In a
- Page 91 and 92: 1 Massachusetts meets the requireme
- Page 93 and 94: A Overall Findings and General Reco
- Page 95 and 96: Designation as student with a disab
- Page 97 and 98: B Specific Findings and Recommendat
- Page 99 and 100: Recommendation 7: Parents of LEP st
- Page 101 and 102: Recommendation 14: Monitor indicato
- Page 103 and 104: (2) We found instances in which stu
- Page 105 and 106: Recommendation 30: The quality of i
- Page 107 and 108: Commonwealth of Massachusetts. (201
- Page 109 and 110: Nathan, J., & Thao, S. (2007). Smal
- Page 111 and 112: Vaznis, J. (2011, Sept. 18). US fin
- Page 113 and 114: Overview The report sought to answe
- Page 115 and 116: Table 1. Variables, Definitions and
- Page 117 and 118: In TBE learn solely in English. In
- Page 119 and 120: Table 2: Variables, Definitions and
- Page 121 and 122: ! ! ! 5. Limitations of the Data Wh
- Page 123 and 124: Table 8: MCAS ELA Pass Rates of LEP
- Page 125 and 126: Table 10. Variables Considered in H
- Page 127 and 128: APPENDIX 2: Additional Tables and F
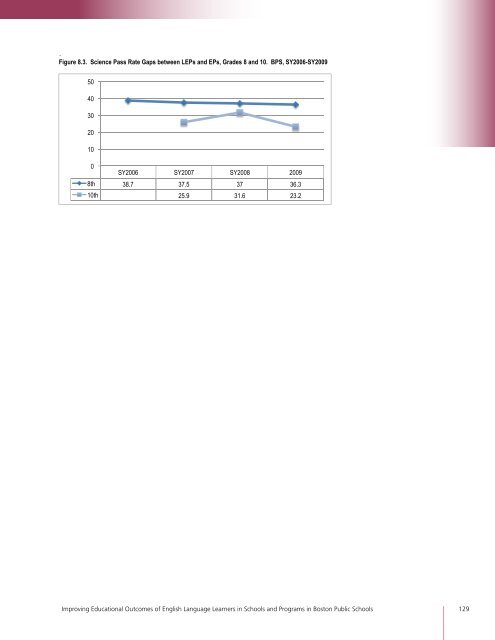
- Page 129 and 130: ! Table 3.2. Characteristics of Eng
- Page 131 and 132: ! ! Table 6.3. English Proficiency
- Page 133: ! Table 7.3. Attendance, Out-of-Sch
- Page 137 and 138: Table 8.2. MCAS Math Pass Rates for
- Page 139 and 140: APPENDIX 3: Characteristics and Out
- Page 141 and 142: ! ! ! ! ! ! Table 4. MCAS ELA and M
- Page 143 and 144: A discussion of our HLM analyses of
- Page 145 and 146: ELA scores on average than LEP stud
- Page 147 and 148: Improving Educational Outcomes of E