

Full Report - Center for Collaborative Education
Full Report - Center for Collaborative Education
Full Report - Center for Collaborative Education

Create successful ePaper yourself
Turn your PDF publications into a flip-book with our unique Google optimized e-Paper software.
!<br />
!<br />
!<br />
!<br />
!<br />
!<br />
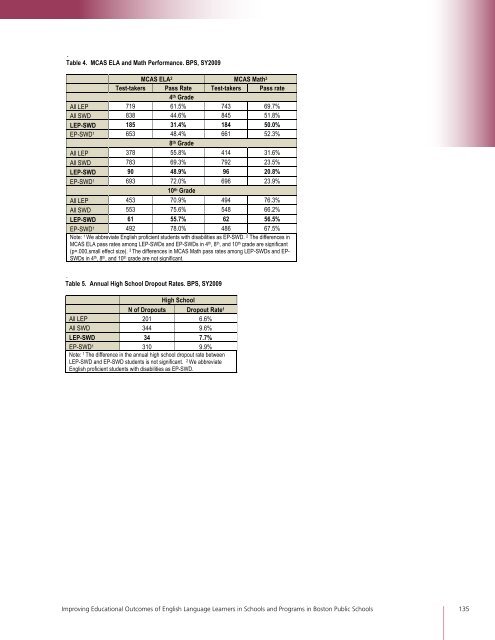
Table 4. MCAS ELA and Math Per<strong>for</strong>mance. BPS, SY2009<br />
MCAS ELA2 MCAS Math3 Test-takers Pass Rate<br />
4<br />
Test-takers Pass rate<br />
th Grade<br />
All LEP 719 61.5% 743 69.7%<br />
All SWD 838 44.6% 845 51.8%<br />
LEP-SWD 185 31.4% 184 50.0%<br />
EP-SWD1 653 48.4%<br />
8<br />
661 52.3%<br />
th Grade<br />
All LEP 378 55.8% 414 31.6%<br />
All SWD 783 69.3% 792 23.5%<br />
LEP-SWD 90 48.9% 96 20.8%<br />
EP-SWD1 693 72.0%<br />
10<br />
696 23.9%<br />
th Grade<br />
All LEP 453 70.9% 494 76.3%<br />
All SWD 553 75.6% 548 66.2%<br />
LEP-SWD 61 55.7% 62 56.5%<br />
EP-SWD1 492 78.0% 486 67.5%<br />
Note: 1 We abbreviate English proficient students with disabilities as EP-SWD. 2 The differences in<br />
MCAS ELA pass rates among LEP-SWDs and EP-SWDs in 4th , 8th , and 10th grade are significant<br />
(p=.000,small effect size). 3 The differences in MCAS Math pass rates among LEP-SWDs and EP-<br />
SWDs in 4th , 8th , and 10th !<br />
grade are not significant.<br />
!<br />
!<br />
Table 5. Annual High School Dropout Rates. BPS, SY2009<br />
High School<br />
N of Dropouts Dropout Rate1 All LEP 201 6.6%<br />
All SWD 344 9.6%<br />
LEP-SWD 34 7.7%<br />
EP-SWD1 310 9.9%<br />
Note: 1 The difference in the annual high school dropout rate between<br />
LEP-SWD and EP-SWD students is not significant. 2 We abbreviate<br />
English proficient students with disabilities as EP-SWD.<br />
!<br />
!<br />
Improving <strong>Education</strong>al Outcomes of English Language Learners in Schools and Programs in Boston Public Schools 135