

Full Report - Center for Collaborative Education
Full Report - Center for Collaborative Education
Full Report - Center for Collaborative Education

You also want an ePaper? Increase the reach of your titles
YUMPU automatically turns print PDFs into web optimized ePapers that Google loves.
Native speakers of Haitian Creole are the second<br />
most prevalent group among Boston’s ELLs. Among<br />
LEP students, speakers of Haitian Creole have also<br />
declined from 9.8 to 9.0% between SY2006 and<br />
SY2009. Native speakers of Haitian Creole represent<br />
one of the largest immigrant communities in<br />
the city of Boston, with a long-standing presence<br />
nurtured by periodic spurts of immigration due to<br />
the economic situation in their country of origin.<br />
Among native speakers of Haitian Creole there is<br />
also a mix of immigrant generations and immigration<br />
statuses. Haitian Creole is the third most frequent<br />
native language found among BPS students,<br />
after English and Spanish.<br />
Cape Verdean Creole is the third most prevalent<br />
language among LEP students and the sixth most<br />
prevalent first language at BPS. The proportion of<br />
LEP students whose first language is Cape Verdean<br />
Creole has increased from 6.9% to 8.2% in the period.<br />
There is a long-standing community of Cape<br />
Verdeans in Boston, constantly nurtured by new<br />
immigration from their island nation, with a mix of<br />
immigrant generations and immigration statuses in<br />
this group of students.<br />
Chinese languages are the third most prevalent first<br />
language at BPS and the fourth among LEP students.<br />
The proportion of BPS students whose first<br />
language is one of the Chinese languages remained<br />
stable between 2006 and 2009, while among<br />
LEPs it declined from 8.1 to 7.8% in the same<br />
period. Like the other groups considered here,<br />
native speakers of Chinese languages come from<br />
a long-standing community with a sizeable core of<br />
U.S.-born Chinese Americans, multiple immigrant<br />
generations, and newer arrivals, leading to a broad<br />
array of immigrant statuses and experiences.<br />
Vietnamese was the fifth most prevalent first language<br />
at BPS and among LEP students in SY2009.<br />
The proportion of LEP students whose first language<br />
is Vietnamese increased from 4.8% to 6.1%<br />
in the period. A community established as the<br />
results of the exodus that followed the end of war<br />
in Vietnam in the 1970s, Vietnamese native speak-<br />
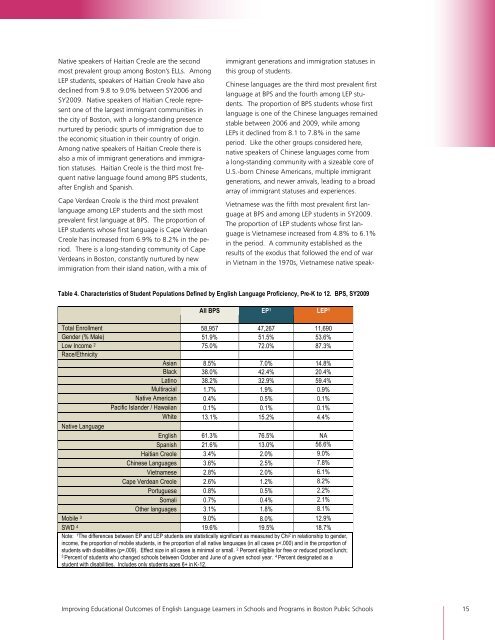
Table 4. Characteristics of Student Populations Defined by English Language Proficiency, Pre-K to 12. BPS, SY2009<br />
!<br />
All BPS EP 1 LEP 1<br />
Total Enrollment 58,957 47,267 11,690<br />
Gender (% Male) 51.9% 51.5% 53.6%<br />
Low Income 2 75.0% 72.0% 87.3%<br />
Race/Ethnicity<br />
Asian 8.5% 7.0% 14.8%<br />
Black 38.0% 42.4% 20.4%<br />
Latino 38.2% 32.9% 59.4%<br />
Multiracial 1.7% 1.9% 0.9%<br />
Native American 0.4% 0.5% 0.1%<br />
Pacific Islander / Hawaiian 0.1% 0.1% 0.1%<br />
White 13.1% 15.2% 4.4%<br />
Native Language<br />
English 61.3% 76.5% NA<br />
Spanish 21.6% 13.0% 56.6%<br />
Haitian Creole 3.4% 2.0% 9.0%<br />
Chinese Languages 3.6% 2.5% 7.8%<br />
Vietnamese 2.8% 2.0% 6.1%<br />
Cape Verdean Creole 2.6% 1.2% 8.2%<br />
Portuguese 0.8% 0.5% 2.2%<br />
Somali 0.7% 0.4% 2.1%<br />
Other languages 3.1% 1.8% 8.1%<br />
Mobile 3 9.0% 8.0% 12.9%<br />
SWD 4 19.6% 19.5% 18.7%<br />
Note: 1 The differences between EP and LEP students are statistically significant as measured by Chi 2 in relationship to gender,<br />
income, the proportion of mobile students, in the proportion of all native languages (in all cases p