The Economic Impact of the UK Film Industry - BFI - British Film ...
The Economic Impact of the UK Film Industry - BFI - British Film ...
The Economic Impact of the UK Film Industry - BFI - British Film ...

You also want an ePaper? Increase the reach of your titles
YUMPU automatically turns print PDFs into web optimized ePapers that Google loves.
<strong>Economic</strong> Contribution <strong>of</strong> <strong>the</strong> <strong>UK</strong> <strong>Film</strong> <strong>Industry</strong><br />
July 2007<br />
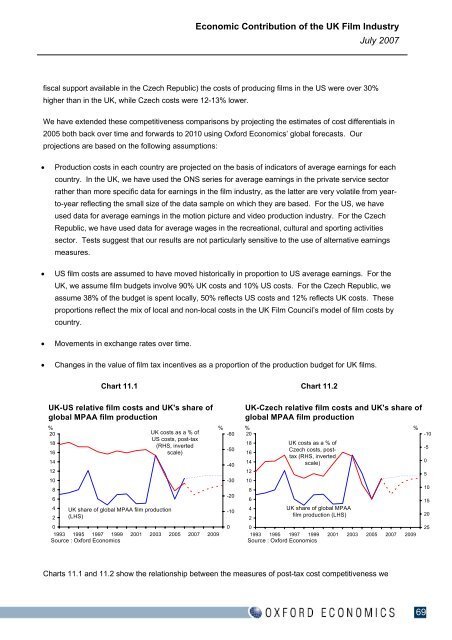
fiscal support available in <strong>the</strong> Czech Republic) <strong>the</strong> costs <strong>of</strong> producing films in <strong>the</strong> US were over 30%<br />
higher than in <strong>the</strong> <strong>UK</strong>, while Czech costs were 12-13% lower.<br />
We have extended <strong>the</strong>se competitiveness comparisons by projecting <strong>the</strong> estimates <strong>of</strong> cost differentials in<br />
2005 both back over time and forwards to 2010 using Oxford <strong>Economic</strong>s’ global forecasts. Our<br />
projections are based on <strong>the</strong> following assumptions:<br />
• Production costs in each country are projected on <strong>the</strong> basis <strong>of</strong> indicators <strong>of</strong> average earnings for each<br />
country. In <strong>the</strong> <strong>UK</strong>, we have used <strong>the</strong> ONS series for average earnings in <strong>the</strong> private service sector<br />
ra<strong>the</strong>r than more specific data for earnings in <strong>the</strong> film industry, as <strong>the</strong> latter are very volatile from yearto-year<br />
reflecting <strong>the</strong> small size <strong>of</strong> <strong>the</strong> data sample on which <strong>the</strong>y are based. For <strong>the</strong> US, we have<br />
used data for average earnings in <strong>the</strong> motion picture and video production industry. For <strong>the</strong> Czech<br />
Republic, we have used data for average wages in <strong>the</strong> recreational, cultural and sporting activities<br />
sector. Tests suggest that our results are not particularly sensitive to <strong>the</strong> use <strong>of</strong> alternative earnings<br />
measures.<br />
• US film costs are assumed to have moved historically in proportion to US average earnings. For <strong>the</strong><br />
<strong>UK</strong>, we assume film budgets involve 90% <strong>UK</strong> costs and 10% US costs. For <strong>the</strong> Czech Republic, we<br />
assume 38% <strong>of</strong> <strong>the</strong> budget is spent locally, 50% reflects US costs and 12% reflects <strong>UK</strong> costs. <strong>The</strong>se<br />
proportions reflect <strong>the</strong> mix <strong>of</strong> local and non-local costs in <strong>the</strong> <strong>UK</strong> <strong>Film</strong> Council’s model <strong>of</strong> film costs by<br />
country.<br />
• Movements in exchange rates over time.<br />
• Changes in <strong>the</strong> value <strong>of</strong> film tax incentives as a proportion <strong>of</strong> <strong>the</strong> production budget for <strong>UK</strong> films.<br />
Chart 11.1 Chart 11.2<br />
<strong>UK</strong>-US relative film costs and <strong>UK</strong>'s share <strong>of</strong><br />
global MPAA film production<br />
%<br />
20<br />
18<br />
16<br />
14<br />
12<br />
10<br />
8<br />
6<br />
4<br />
2<br />
<strong>UK</strong> share <strong>of</strong> global MPAA film production<br />
(LHS)<br />
<strong>UK</strong> costs as a % <strong>of</strong><br />
US costs, post-tax<br />
(RHS, inverted<br />
scale)<br />
0<br />
1993 1995 1997 1999 2001 2003 2005 2007 2009<br />
Source : Oxford <strong>Economic</strong>s<br />
<strong>UK</strong>-Czech relative film costs and <strong>UK</strong>'s share <strong>of</strong><br />
global MPAA film production<br />
0<br />
1993 1995 1997 1999 2001 2003 2005 2007 2009<br />
Source : Oxford <strong>Economic</strong>s<br />
Charts 11.1 and 11.2 show <strong>the</strong> relationship between <strong>the</strong> measures <strong>of</strong> post-tax cost competitiveness we<br />
%<br />
-60<br />
-50<br />
-40<br />
-30<br />
-20<br />
-10<br />
0<br />
%<br />
20<br />
18<br />
16<br />
14<br />
12<br />
10<br />
8<br />
6<br />
4<br />
2<br />
<strong>UK</strong> costs as a % <strong>of</strong><br />
Czech costs, posttax<br />
(RHS, inverted<br />
scale)<br />
<strong>UK</strong> share <strong>of</strong> global MPAA<br />
film production (LHS)<br />
%<br />
69<br />
-10<br />
-5<br />
0<br />
5<br />
10<br />
15<br />
20<br />
25