Project Deliverable D50 Report on Best Practices ... - ESONET NoE
Project Deliverable D50 Report on Best Practices ... - ESONET NoE
Project Deliverable D50 Report on Best Practices ... - ESONET NoE

Create successful ePaper yourself
Turn your PDF publications into a flip-book with our unique Google optimized e-Paper software.
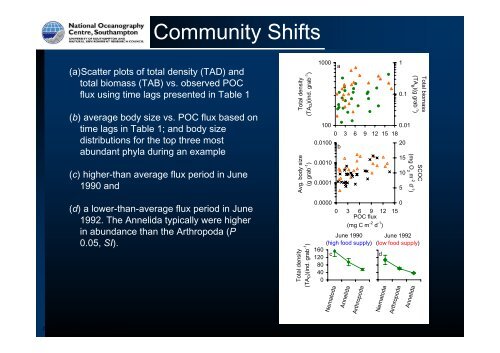
Community Shifts<br />
(a)Scatter plots of total density (TAD) and<br />
total biomass (TAB) vs. observed POC<br />
flux using time lags presented in Table 1<br />
(b) average body size vs. POC flux based <strong>on</strong><br />
time lags in Table 1; and body size<br />
distributi<strong>on</strong>s for the top three most<br />
abundant phyla during an example<br />
(c) higher-than average flux period in June<br />
1990 and<br />
(d) a lower-than-average flux period in June<br />
1992. The Annelida typically were higher<br />
in abundance than the Arthropoda (P<br />
0.05, SI).<br />
Total density<br />
(TA D)(ind. grab -1 )<br />
Total density<br />
(TA D)(ind. grab -1 )<br />
1000<br />
160<br />
120<br />
80<br />
40<br />
0<br />
100<br />
0.0100<br />
0.0010<br />
0.0001<br />
0.0000<br />
a<br />
b<br />
June 1990<br />
(high food supply)<br />
Nematoda<br />
0.01<br />
0 3 6 9 12 15 18<br />
0 3 6 9 12 15<br />
POC flux<br />
c d<br />
Annelida<br />
(mg C m -2 d -1 )<br />
Arthropoda<br />
June 1992<br />
(low food supply)<br />
<str<strong>on</strong>g>Deliverable</str<strong>on</strong>g> #50 - update October 2010 130<br />
Avg. body size<br />
(g grab -1 )<br />
Nematoda<br />
Arthropoda<br />
1<br />
0.1<br />
20<br />
15<br />
10<br />
5<br />
0<br />
Annelida<br />
Total biomass<br />
(TA B )(g grab -1 )<br />
SCOC<br />
(mg O 2 m -2 d -1 )