Project Deliverable D50 Report on Best Practices ... - ESONET NoE
Project Deliverable D50 Report on Best Practices ... - ESONET NoE
Project Deliverable D50 Report on Best Practices ... - ESONET NoE

You also want an ePaper? Increase the reach of your titles
YUMPU automatically turns print PDFs into web optimized ePapers that Google loves.
Comm<strong>on</strong> topics <strong>on</strong> time series analysis (Henry Ruhl)<br />
•Comm<strong>on</strong> issues to c<strong>on</strong>sider when analysing time-series data include comparing results from<br />
studies that look at different scales (e.g. seas<strong>on</strong>al versus interannual); secular trends and<br />
detrending time series; trends over sub-secti<strong>on</strong>s of time series; aliasing such as when data is<br />
unevenly distributed across time; gap filling; empirical, dynamical, hindcasting, forecasting,<br />
and jackknife modelling techniques; correcting for calibrati<strong>on</strong>; serial autocorrelati<strong>on</strong>; n<strong>on</strong>linear<br />
vs. linear behaviour in observati<strong>on</strong>s; parametric and n<strong>on</strong>-parametric assumpti<strong>on</strong>s;<br />
multidimensi<strong>on</strong>al analysis; and understanding the spatial applicability of times-series data<br />
from <strong>on</strong>e or a network of instruments (e.g. Sokal and Rohlf 1981, Hurlbert 1984, Heikkilai<br />
1988, Clarke 1993, Pyper and Peterman 1998, Clarke Warwick 2001, Perry and Liebhold<br />
2002, Quinn and Keough 2002, Buckland et al. 2007)<br />
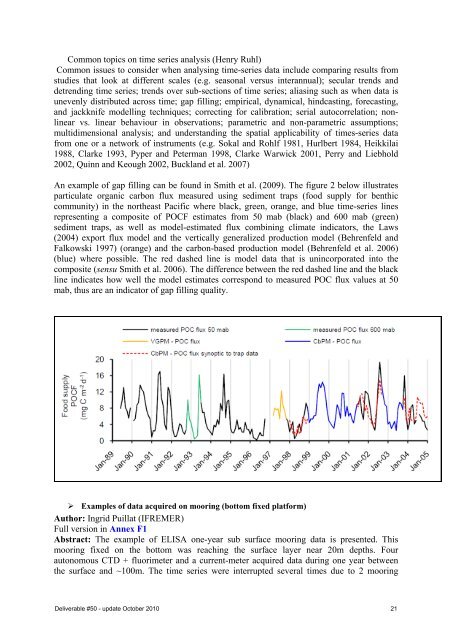
An example of gap filling can be found in Smith et al. (2009). The figure 2 below illustrates<br />
particulate organic carb<strong>on</strong> flux measured using sediment traps (food supply for benthic<br />
community) in the northeast Pacific where black, green, orange, and blue time-series lines<br />
representing a composite of POCF estimates from 50 mab (black) and 600 mab (green)<br />
sediment traps, as well as model-estimated flux combining climate indicators, the Laws<br />
(2004) export flux model and the vertically generalized producti<strong>on</strong> model (Behrenfeld and<br />
Falkowski 1997) (orange) and the carb<strong>on</strong>-based producti<strong>on</strong> model (Behrenfeld et al. 2006)<br />
(blue) where possible. The red dashed line is model data that is unincorporated into the<br />
composite (sensu Smith et al. 2006). The difference between the red dashed line and the black<br />
line indicates how well the model estimates corresp<strong>on</strong>d to measured POC flux values at 50<br />
mab, thus are an indicator of gap filling quality.<br />
Examples of data acquired <strong>on</strong> mooring (bottom fixed platform)<br />
Author: Ingrid Puillat (IFREMER)<br />
Full versi<strong>on</strong> in Annex F1<br />
Abstract: The example of ELISA <strong>on</strong>e-year sub surface mooring data is presented. This<br />
mooring fixed <strong>on</strong> the bottom was reaching the surface layer near 20m depths. Four<br />
aut<strong>on</strong>omous CTD + fluorimeter and a current-meter acquired data during <strong>on</strong>e year between<br />
the surface and ~100m. The time series were interrupted several times due to 2 mooring<br />
<str<strong>on</strong>g>Deliverable</str<strong>on</strong>g> #50 - update October 2010 21