ER-200D Personal Noise Dosimeter with Data Logging User Manual
ER-200D Personal Noise Dosimeter with Data Logging User Manual
ER-200D Personal Noise Dosimeter with Data Logging User Manual

You also want an ePaper? Increase the reach of your titles
YUMPU automatically turns print PDFs into web optimized ePapers that Google loves.
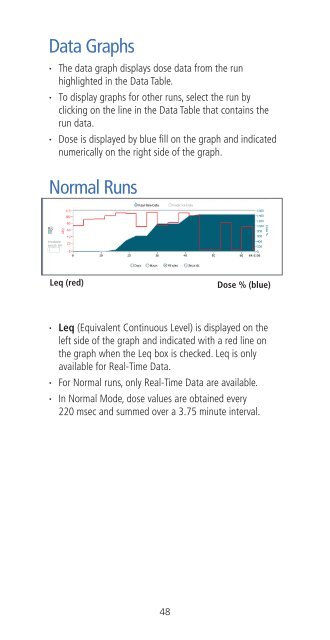
<strong>Data</strong> Graphs<br />
· The data graph displays dose data from the run<br />
highlighted in the <strong>Data</strong> Table.<br />
· To display graphs for other runs, select the run by<br />
clicking on the line in the <strong>Data</strong> Table that contains the<br />
run data.<br />
· Dose is displayed by blue fill on the graph and indicated<br />
numerically on the right side of the graph.<br />
Normal Runs<br />
Leq (red) Dose % (blue)<br />
· Leq (Equivalent Continuous Level) is displayed on the<br />
left side of the graph and indicated <strong>with</strong> a red line on<br />
the graph when the Leq box is checked. Leq is only<br />
available for Real-Time <strong>Data</strong>.<br />
· For Normal runs, only Real-Time <strong>Data</strong> are available.<br />
· In Normal Mode, dose values are obtained every<br />
220 msec and summed over a 3.75 minute interval.<br />
48