2010-09-06 YURA_SWOT- PP4 - EU-Regionalmanagement ...
2010-09-06 YURA_SWOT- PP4 - EU-Regionalmanagement ...
2010-09-06 YURA_SWOT- PP4 - EU-Regionalmanagement ...

Create successful ePaper yourself
Turn your PDF publications into a flip-book with our unique Google optimized e-Paper software.
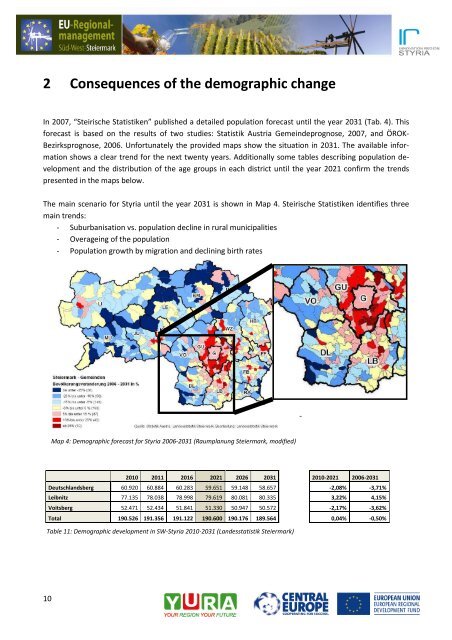
2 Consequences of the demographic change<br />
In 2007, “Steirische Statistiken” published a detailed population forecast until the year 2031 (Tab. 4). This<br />
forecast is based on the results of two studies: Statistik Austria Gemeindeprognose, 2007, and ÖROK-<br />
Bezirksprognose, 20<strong>06</strong>. Unfortunately the provided maps show the situation in 2031. The available information<br />
shows a clear trend for the next twenty years. Additionally some tables describing population development<br />
and the distribution of the age groups in each district until the year 2021 confirm the trends<br />
presented in the maps below.<br />
The main scenario for Styria until the year 2031 is shown in Map 4. Steirische Statistiken identifies three<br />
main trends:<br />
- Suburbanisation vs. population decline in rural municipalities<br />
- Overageing of the population<br />
- Population growth by migration and declining birth rates<br />
10<br />
Map 4: Demographic forecast for Styria 20<strong>06</strong>-2031 (Raumplanung Steiermark, modified)<br />
<strong>2010</strong> 2011 2016 2021 2026 2031 <strong>2010</strong>-2021 20<strong>06</strong>-2031<br />
Deutschlandsberg 60.920 60.884 60.283 59.651 59.148 58.657 -2,08% -3,71%<br />
Leibnitz 77.135 78.038 78.998 79.619 80.081 80.335 3,22% 4,15%<br />
Voitsberg 52.471 52.434 51.841 51.330 50.947 50.572 -2,17% -3,62%<br />
Total 190.526 191.356 191.122 190.600 190.176 189.564 0,04% -0,50%<br />
Table 11: Demographic development in SW-Styria <strong>2010</strong>-2031 (Landesstatistik Steiermark)<br />
-