2010-09-06 YURA_SWOT- PP4 - EU-Regionalmanagement ...
2010-09-06 YURA_SWOT- PP4 - EU-Regionalmanagement ...
2010-09-06 YURA_SWOT- PP4 - EU-Regionalmanagement ...

Create successful ePaper yourself
Turn your PDF publications into a flip-book with our unique Google optimized e-Paper software.
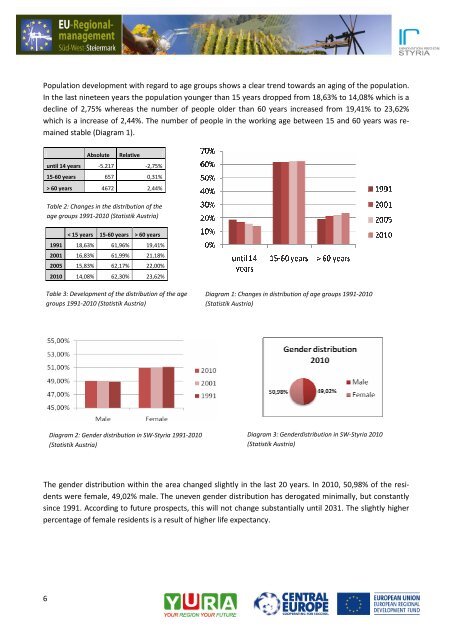
Population development with regard to age groups shows a clear trend towards an aging of the population.<br />
In the last nineteen years the population younger than 15 years dropped from 18,63% to 14,08% which is a<br />
decline of 2,75% whereas the number of people older than 60 years increased from 19,41% to 23,62%<br />
which is a increase of 2,44%. The number of people in the working age between 15 and 60 years was remained<br />
stable (Diagram 1).<br />
The gender distribution within the area changed slightly in the last 20 years. In <strong>2010</strong>, 50,98% of the residents<br />
were female, 49,02% male. The uneven gender distribution has derogated minimally, but constantly<br />
since 1991. According to future prospects, this will not change substantially until 2031. The slightly higher<br />
percentage of female residents is a result of higher life expectancy.<br />
6<br />
Absolute Relative<br />
until 14 years -5.217 -2,75%<br />
15-60 years 657 0,31%<br />
> 60 years 4672 2,44%<br />
Table 2: Changes in the distribution of the<br />
age groups 1991-<strong>2010</strong> (Statistik Austria)<br />
< 15 years 15-60 years > 60 years<br />
1991 18,63% 61,96% 19,41%<br />
2001 16,83% 61,99% 21,18%<br />
2005 15,83% 62,17% 22,00%<br />
<strong>2010</strong> 14,08% 62,30% 23,62%<br />
Table 3: Development of the distribution of the age<br />
groups 1991-<strong>2010</strong> (Statistik Austria)<br />
Diagram 2: Gender distribution in SW-Styria 1991-<strong>2010</strong><br />
(Statistik Austria)<br />
Diagram 1: Changes in distribution of age groups 1991-<strong>2010</strong><br />
(Statistik Austria)<br />
Diagram 3: Genderdistribution in SW-Styria <strong>2010</strong><br />
(Statistik Austria)