Summer Undergraduate Research Program - Fred Hutchinson ...
Summer Undergraduate Research Program - Fred Hutchinson ...
Summer Undergraduate Research Program - Fred Hutchinson ...

Create successful ePaper yourself
Turn your PDF publications into a flip-book with our unique Google optimized e-Paper software.
The Title of This Poster is Printed at 96 Points, in a Shaded<br />
Text Box<br />
If you put a logo on your poster<br />
use an image file that was created<br />
for a print density, not one from<br />
the web.<br />
Most images you would download<br />
from the web will print poorly on a<br />
large format poster.<br />
Author 1, Author 2, Author 3, (the authors and addresses are in 80 point font)<br />
Institution 1, City 1, State 1, Country; Institution 2, City 2, State 2, Country 2, ….<br />
There are copyright concerns<br />
about these logos, so be sure to<br />
use them properly.<br />
Example Poster Format<br />
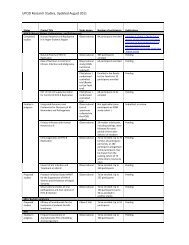
RESULTS (con’td.)<br />
RESULTS<br />
Sometimes its helpful to state the interpretation of the data image<br />
as it’s heading:<br />
The major results are often displayed in the center of the poster.<br />
ABSTRACT (48 point, bold)<br />
Or<br />
INTRODUCTION<br />
Data tables can be pasted in from work or Excel or created directly<br />
in poser point<br />
The abstract or introduction section often goes here. This text is<br />
often in 24 to 36 point.<br />
Over-expression of gene b is correlated with<br />
faster clearance of compound Y.<br />
You can group text boxes or objects.<br />
You can use color in your font to make emphases, or color in text<br />
box shading relate topics.<br />
You can align them to be appear as a single column: select the text<br />
box, or objet and under format, them position, you can set it to be<br />
located at a precise distance from the edge of the poster. All of the<br />
elements in the column can be registered using this method, or by<br />
using guides or by using the rulers on the edges of the slide<br />
screen.<br />
This is where you state the<br />
Hypothesis<br />
106<br />
Significance of the research problem<br />
Condition Data 1 Data 2 Data 3<br />
control 0 0 0<br />
Key work already done by you (your mentor’s group) or others.<br />
Very, very brief background information.<br />
A 10 10 10<br />
Materials and Methods<br />
CONCLUSIONS<br />
B 12 11 9<br />
New New method for measuring compound Y is faster and more<br />
accurate<br />
C 42 48 44<br />
This is usually a very brief description, flow charts are a good way<br />
to convey the experimental design and the methods. You can use<br />
templates in the SmartArt Graphics menu in powerpoint.<br />
Gene Gene B is crucial for process Z.<br />
D 11 12 11<br />
Need Need to further analysis on …..<br />
E 9 10 9<br />
ACKNOWLEDGEMENTS<br />
Its always important to acknowledge the funding source of your<br />
research by grant number and agency; as well as anyone who<br />
helped on the project that is already included as an author.