

THE FIAT GROUP IN - Fiat SpA
THE FIAT GROUP IN - Fiat SpA
THE FIAT GROUP IN - Fiat SpA

Create successful ePaper yourself
Turn your PDF publications into a flip-book with our unique Google optimized e-Paper software.
74<br />
74<br />
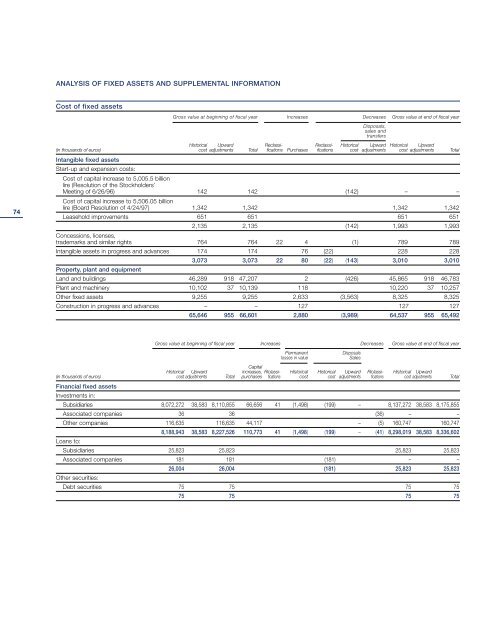
ANALYSIS OF FIXED ASSETS AND SUPPLEMENTAL <strong>IN</strong>FORMATION<br />
Cost of fixed assets<br />
Gross value at beginning of fiscal year Increases Decreases<br />
Disposals,<br />
sales and<br />
transfers<br />
Gross value at end of fiscal year<br />
Historical Upward Reclassi- Reclassi- Historical Upward Historical Upward<br />
(in thousands of euros)<br />
Intangible fixed assets<br />
Start-up and expansion costs:<br />
Cost of capital increase to 5,005.5 billion<br />
lire (Resolution of the Stockholders’<br />
cost adjustments Total fications Purchases fications cost adjustments cost adjustments Total<br />
Meeting of 6/26/96)<br />
Cost of capital increase to 5,506.05 billion<br />
142 142 (142) – –<br />
lire (Board Resolution of 4/24/97) 1,342 1,342 1,342 1,342<br />
Leasehold improvements 651 651 651 651<br />
Concessions, licenses,<br />
2,135 2,135 (142) 1,993 1,993<br />
trademarks and similar rights 764 764 22 4 (1) 789 789<br />
Intangible assets in progress and advances 174 174 76 (22) 228 228<br />
3,073 3,073 22 80 (22) (143) 3,010 3,010<br />
Property, plant and equipment<br />
Land and buildings 46,289 918 47,207 2 (426) 45,865 918 46,783<br />
Plant and machinery 10,102 37 10,139 118 10,220 37 10,257<br />
Other fixed assets 9,255 9,255 2,633 (3,563) 8,325 8,325<br />
Construction in progress and advances – – 127 127 127<br />
65,646 955 66,601 2,880 (3,989) 64,537 955 65,492<br />
Gross value at beginning of fiscal year Increases Decreases Gross value at end of fiscal year<br />
Permanent Disposals<br />
losses in value Sales<br />
(in thousands of euros)<br />
Historical Upward<br />
cost adjustments Total<br />
Capital<br />
increases, Riclassipurchases<br />
fications<br />
Historical<br />
cost<br />
Historical<br />
cost<br />
Upward<br />
adjustments<br />
Riclassifications<br />
Historical Upward<br />
cost adjustments Total<br />
Financial fixed assets<br />
Investments in:<br />
Subsidiaries 8,072,272 38,583 8,110,855 66,656 41 (1,498) (199) – 8,137,272 38,583 8,175,855<br />
Associated companies 36 36 (36) – –<br />
Other companies 116,635 116,635 44,117 – (5) 160,747 160,747<br />
8,188,943 38,583 8,227,526 110,773 41 (1,498) (199) – (41) 8,298,019 38,583 8,336,602<br />
Loans to:<br />
Subsidiaries 25,823 25,823 25,823 25,823<br />
Associated companies 181 181 (181) – –<br />
Other securities:<br />
26,004 26,004 (181) 25,823 25,823<br />
Debt securities 75 75 75 75<br />
75 75 75 75


