BA II PLUS™ PROFESSIONAL Calculator
BA II PLUS™ PROFESSIONAL Calculator
BA II PLUS™ PROFESSIONAL Calculator

You also want an ePaper? Increase the reach of your titles
YUMPU automatically turns print PDFs into web optimized ePapers that Google loves.
• When you enter data for one-variable statistics, Xnn represents the<br />
value and Ynn specifies the number of occurrences (frequency).<br />
• When you enter a value for Xnn, the value for Ynn defaults to 1.<br />
Analyzing One-Variable Statistics<br />
To analyze one-variable statistics, select 1-V. Only values for n, v, Sx, sX,<br />
GX, and GX 2 are computed and displayed for one-variable statistics.<br />
Analyzing Two-Variable Statistics<br />
You can choose from among these four regression-analysis methods:<br />
• LIN<br />
• Ln<br />
• EXP<br />
• PWR<br />
Computing Values Automatically<br />
Except for the predicted X' and Y' values, the calculator computes and<br />
displays values for statistics variables automatically when you access<br />
them.<br />
Using X' and Y' for Regression Predictions<br />
To use the X' and Y' variables for regression predictions, you either can<br />
enter a value for X' to compute Y' or enter a value for Y' to compute X'.<br />
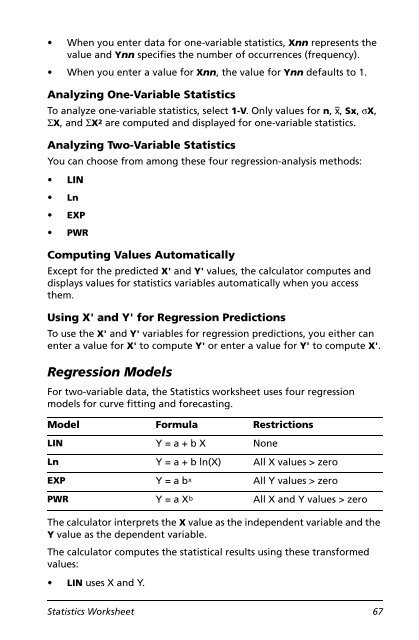
Regression Models<br />
For two-variable data, the Statistics worksheet uses four regression<br />
models for curve fitting and forecasting.<br />
Model Formula Restrictions<br />
LIN Y = a + b X None<br />
Ln Y = a + b ln(X) All X values > zero<br />
EXP Y = a b x All Y values > zero<br />
PWR Y = a X b All X and Y values > zero<br />
The calculator interprets the X value as the independent variable and the<br />
Y value as the dependent variable.<br />
The calculator computes the statistical results using these transformed<br />
values:<br />
• LIN uses X and Y.<br />
Statistics Worksheet 67