

2011 National Survey of Fishing, Hunting, and ... - Census Bureau
2011 National Survey of Fishing, Hunting, and ... - Census Bureau
2011 National Survey of Fishing, Hunting, and ... - Census Bureau

You also want an ePaper? Increase the reach of your titles
YUMPU automatically turns print PDFs into web optimized ePapers that Google loves.
2001–<strong>2011</strong> Comparison<br />
Comparing the estimates from the<br />
2001, 2006, <strong>and</strong> <strong>2011</strong> <strong>Survey</strong>s gives<br />
a perspective on the state <strong>of</strong> wildliferelated<br />
recreation in the early twentyfirst<br />
century in Vermont. Only the most<br />
general recreation comparisons are<br />
presented here.<br />
The best way to compare estimates<br />
from surveys is not to compare the<br />
estimates themselves but to compare<br />
the confidence intervals around the estimates.<br />
A 90-percent confidence interval<br />
around the estimate gives the range <strong>of</strong><br />
estimates that 90 percent <strong>of</strong> all possible<br />
representative samples would supply. If<br />
the 90-percent confidence intervals <strong>of</strong><br />
the two surveys’ estimates overlap, it<br />
is not possible to say the two estimates<br />
are statistically different.<br />
The state resident estimates cover the<br />
participation <strong>and</strong> expenditure activity<br />
<strong>of</strong> Vermont residents anywhere in<br />
the United States. The in-state estimates<br />
cover the participation, day, <strong>and</strong><br />
expenditure activity if U.S. residents in<br />
Vermont.<br />
The expenditure estimates were made<br />
comparable by adjusting the estimates<br />
for inflation—all estimates are in <strong>2011</strong><br />
dollars.<br />
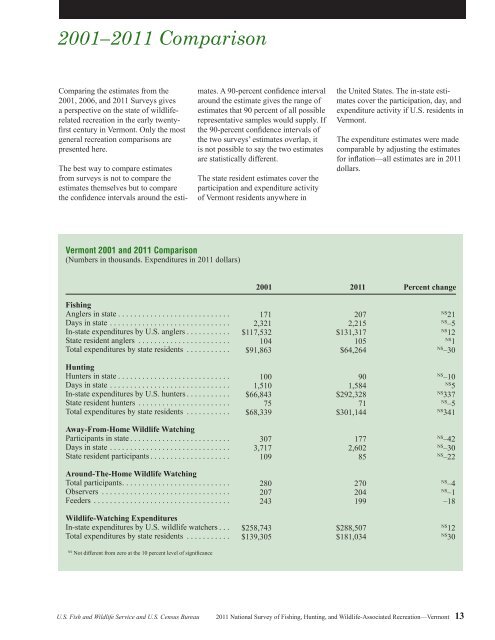
Vermont 2001 <strong>and</strong> <strong>2011</strong> Comparison<br />
(Numbers in thous<strong>and</strong>s. Expenditures in <strong>2011</strong> dollars)<br />
.<br />
<strong>Fishing</strong><br />
Anglers in state ............................<br />
Days in state ..............................<br />
In-state expenditures by U.S. anglers ...........<br />
State resident anglers .......................<br />
Total expenditures by state residents ...........<br />
<strong>Hunting</strong><br />
Hunters in state ............................<br />
Days in state ..............................<br />
In-state expenditures by U.S. hunters ...........<br />
State resident hunters .......................<br />
Total expenditures by state residents ...........<br />
Away-From-Home Wildlife Watching<br />
Participants in state .........................<br />
Days in state ..............................<br />
State resident participants ....................<br />
Around-The-Home Wildlife Watching<br />
Total participants ...........................<br />
Observers ................................<br />
Feeders ..................................<br />
Wildlife-Watching Expenditures<br />
In-state expenditures by U.S. wildlife watchers ...<br />
Total expenditures by state residents ...........<br />
2001 <strong>2011</strong> Percent change<br />
171 207<br />
NS<br />
21<br />
2,321 2,215<br />
NS<br />
–5<br />
$117,532 $131,317<br />
NS<br />
12<br />
104 105<br />
NS<br />
1<br />
$91,863 $64,264<br />
NS<br />
–30<br />
100 90<br />
NS<br />
–10<br />
1,510 1,584<br />
NS<br />
5<br />
$66,843 $292,328<br />
NS<br />
337<br />
75 71<br />
NS<br />
–5<br />
$68,339 $301,144<br />
NS<br />
341<br />
307 177<br />
NS<br />
–42<br />
3,717 2,602<br />
NS<br />
–30<br />
109 85<br />
NS<br />
–22<br />
280 270<br />
NS<br />
–4<br />
207 204<br />
NS<br />
–1<br />
243 199 –18<br />
$258,743 $288,507<br />
NS<br />
12<br />
$139,305 $181,034<br />
NS<br />
30<br />
NS<br />
Not different from zero at the 10 percent level <strong>of</strong> significance<br />
U.S. Fish <strong>and</strong> Wildlife Service <strong>and</strong> U.S. <strong>Census</strong> <strong>Bureau</strong> <strong>2011</strong> <strong>National</strong> <strong>Survey</strong> <strong>of</strong> <strong>Fishing</strong>, <strong>Hunting</strong>, <strong>and</strong> Wildlife-Associated Recreation—Vermont 13


