

2011 National Survey of Fishing, Hunting, and ... - Census Bureau
2011 National Survey of Fishing, Hunting, and ... - Census Bureau
2011 National Survey of Fishing, Hunting, and ... - Census Bureau

Create successful ePaper yourself
Turn your PDF publications into a flip-book with our unique Google optimized e-Paper software.
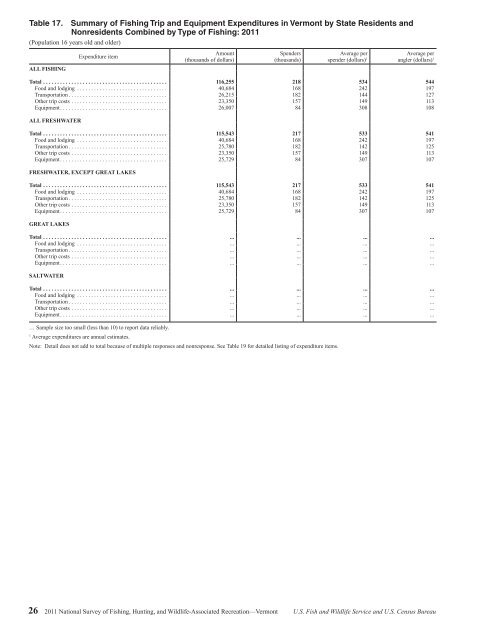
Table 17. Summary <strong>of</strong> <strong>Fishing</strong> Trip <strong>and</strong> Equipment Expenditures in Vermont by State Residents <strong>and</strong><br />
Nonresidents Combined by Type <strong>of</strong> <strong>Fishing</strong>: <strong>2011</strong><br />
(Population 16 years old <strong>and</strong> older)<br />
ALL FISHING<br />
Expenditure item<br />
Amount<br />
(thous<strong>and</strong>s <strong>of</strong> dollars)<br />
Spenders<br />
(thous<strong>and</strong>s)<br />
Average per<br />
spender (dollars) 1<br />
Average per<br />
angler (dollars) 1<br />
Total ............................................ 116,255 218 534 544<br />
Food <strong>and</strong> lodging ................................ 40,684 168 242 197<br />
Transportation ................................... 26,215 182 144 127<br />
Other trip costs .................................. 23,350 157 149 113<br />
Equipment ...................................... 26,007 84 308 108<br />
ALL FRESHWATER<br />
Total ............................................ 115,543 217 533 541<br />
Food <strong>and</strong> lodging ................................ 40,684 168 242 197<br />
Transportation ................................... 25,780 182 142 125<br />
Other trip costs .................................. 23,350 157 149 113<br />
Equipment ...................................... 25,729 84 307 107<br />
FRESHWATER, EXCEPT GREAT LAKES<br />
Total ............................................ 115,543 217 533 541<br />
Food <strong>and</strong> lodging ................................ 40,684 168 242 197<br />
Transportation ................................... 25,780 182 142 125<br />
Other trip costs .................................. 23,350 157 149 113<br />
Equipment ...................................... 25,729 84 307 107<br />
GREAT LAKES<br />
Total ............................................ ... ... ... ...<br />
Food <strong>and</strong> lodging ................................ ... ... ... ...<br />
Transportation ................................... ... ... ... ...<br />
Other trip costs .................................. ... ... ... ...<br />
Equipment ...................................... ... ... ... ...<br />
SALTWATER<br />
Total ............................................ ... ... ... ...<br />
Food <strong>and</strong> lodging ................................ ... ... ... ...<br />
Transportation ................................... ... ... ... ...<br />
Other trip costs .................................. ... ... ... ...<br />
Equipment ...................................... ... ... ... ...<br />
… Sample size too small (less than 10) to report data reliably.<br />
1<br />
Average expenditures are annual estimates.<br />
Note: Detail does not add to total because <strong>of</strong> multiple responses <strong>and</strong> nonresponse. See Table 19 for detailed listing <strong>of</strong> expenditure items.<br />
26 <strong>2011</strong> <strong>National</strong> <strong>Survey</strong> <strong>of</strong> <strong>Fishing</strong>, <strong>Hunting</strong>, <strong>and</strong> Wildlife-Associated Recreation—Vermont U.S. Fish <strong>and</strong> Wildlife Service <strong>and</strong> U.S. <strong>Census</strong> <strong>Bureau</strong>


