

2011 National Survey of Fishing, Hunting, and ... - Census Bureau
2011 National Survey of Fishing, Hunting, and ... - Census Bureau
2011 National Survey of Fishing, Hunting, and ... - Census Bureau

Create successful ePaper yourself
Turn your PDF publications into a flip-book with our unique Google optimized e-Paper software.
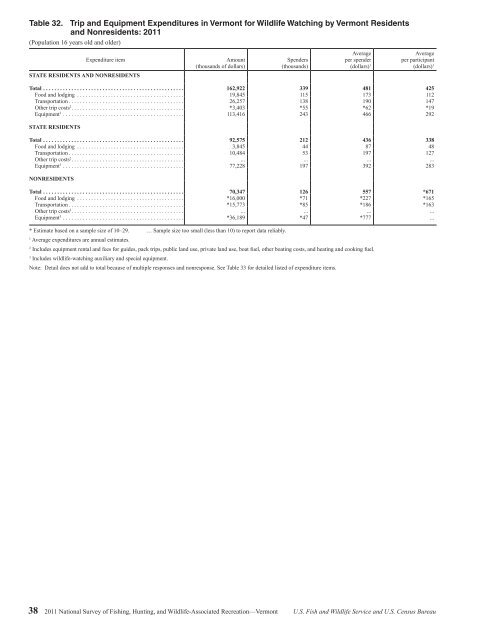
Table 32. Trip <strong>and</strong> Equipment Expenditures in Vermont for Wildlife Watching by Vermont Residents<br />
<strong>and</strong> Nonresidents: <strong>2011</strong><br />
(Population 16 years old <strong>and</strong> older)<br />
Expenditure item<br />
STATE RESIDENTS AND NONRESIDENTS<br />
Amount<br />
(thous<strong>and</strong>s <strong>of</strong> dollars)<br />
Spenders<br />
(thous<strong>and</strong>s)<br />
Average<br />
per spender<br />
(dollars) 1<br />
Average<br />
per participant<br />
(dollars) 1<br />
Total .................................................. 162,922 339 481 425<br />
Food <strong>and</strong> lodging ...................................... 19,845 115 173 112<br />
Transportation ......................................... 26,257 138 190 147<br />
Other trip costs 2 ........................................ *3,403 *55 *62 *19<br />
Equipment 3 ........................................... 113,416 243 466 292<br />
STATE RESIDENTS<br />
Total .................................................. 92,575 212 436 338<br />
Food <strong>and</strong> lodging ...................................... 3,845 44 87 48<br />
Transportation ......................................... 10,484 53 197 127<br />
Other trip costs 2 ........................................ ... ... ... ...<br />
Equipment 3 ........................................... 77,228 197 392 283<br />
NONRESIDENTS<br />
Total .................................................. 70,347 126 557 *671<br />
Food <strong>and</strong> lodging ...................................... *16,000 *71 *227 *165<br />
Transportation ......................................... *15,773 *85 *186 *163<br />
Other trip costs 2 ........................................ ... ... ... ...<br />
Equipment 3 ........................................... *36,189 *47 *777 ...<br />
* Estimate based on a sample size <strong>of</strong> 10–29. … Sample size too small (less than 10) to report data reliably.<br />
1<br />
Average expenditures are annual estimates.<br />
2<br />
Includes equipment rental <strong>and</strong> fees for guides, pack trips, public l<strong>and</strong> use, private l<strong>and</strong> use, boat fuel, other boating costs, <strong>and</strong> heating <strong>and</strong> cooking fuel.<br />
3<br />
Includes wildlife-watching auxiliary <strong>and</strong> special equipment.<br />
Note: Detail does not add to total because <strong>of</strong> multiple responses <strong>and</strong> nonresponse. See Table 33 for detailed listed <strong>of</strong> expenditure items.<br />
38 <strong>2011</strong> <strong>National</strong> <strong>Survey</strong> <strong>of</strong> <strong>Fishing</strong>, <strong>Hunting</strong>, <strong>and</strong> Wildlife-Associated Recreation—Vermont U.S. Fish <strong>and</strong> Wildlife Service <strong>and</strong> U.S. <strong>Census</strong> <strong>Bureau</strong>


