

2011 National Survey of Fishing, Hunting, and ... - Census Bureau
2011 National Survey of Fishing, Hunting, and ... - Census Bureau
2011 National Survey of Fishing, Hunting, and ... - Census Bureau

You also want an ePaper? Increase the reach of your titles
YUMPU automatically turns print PDFs into web optimized ePapers that Google loves.
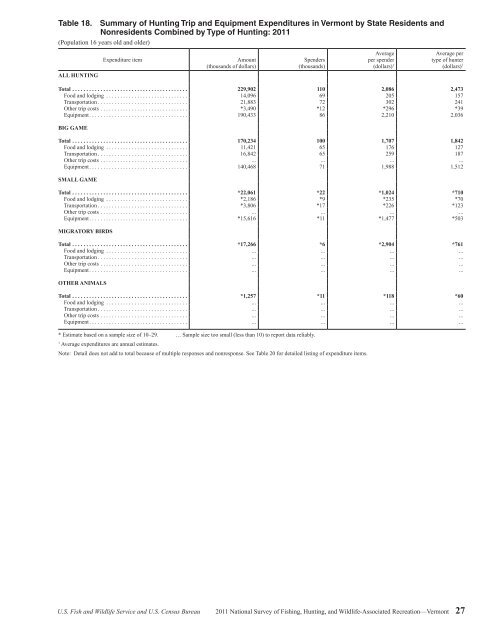
Table 18. Summary <strong>of</strong> <strong>Hunting</strong> Trip <strong>and</strong> Equipment Expenditures in Vermont by State Residents <strong>and</strong><br />
Nonresidents Combined by Type <strong>of</strong> <strong>Hunting</strong>: <strong>2011</strong><br />
(Population 16 years old <strong>and</strong> older)<br />
ALL HUNTING<br />
Expenditure item<br />
Amount<br />
(thous<strong>and</strong>s <strong>of</strong> dollars)<br />
Spenders<br />
(thous<strong>and</strong>s)<br />
Average<br />
per spender<br />
(dollars) 1<br />
Average per<br />
type <strong>of</strong> hunter<br />
(dollars) 1<br />
Total ......................................... 229,902 110 2,086 2,473<br />
Food <strong>and</strong> lodging ............................. 14,096 69 205 157<br />
Transportation ................................ 21,883 72 302 241<br />
Other trip costs ............................... *3,490 *12 *296 *39<br />
Equipment ................................... 190,433 86 2,210 2,036<br />
BIG GAME<br />
Total ......................................... 170,234 100 1,707 1,842<br />
Food <strong>and</strong> lodging ............................. 11,421 65 176 127<br />
Transportation ................................ 16,842 65 259 187<br />
Other trip costs ............................... ... ... ... ...<br />
Equipment ................................... 140,468 71 1,988 1,512<br />
SMALL GAME<br />
Total ......................................... *22,061 *22 *1,024 *710<br />
Food <strong>and</strong> lodging ............................. *2,186 *9 *235 *70<br />
Transportation ................................ *3,806 *17 *226 *123<br />
Other trip costs ............................... ... ... ... ...<br />
Equipment ................................... *15,616 *11 *1,477 *503<br />
MIGRATORY BIRDS<br />
Total ......................................... *17,266 *6 *2,904 *761<br />
Food <strong>and</strong> lodging ............................. ... ... ... ...<br />
Transportation ................................ ... ... ... ...<br />
Other trip costs ............................... ... ... ... ...<br />
Equipment ................................... ... ... ... ...<br />
OTHER ANIMALS<br />
Total ......................................... *1,257 *11 *118 *60<br />
Food <strong>and</strong> lodging ............................. ... ... ... ...<br />
Transportation ................................ ... ... ... ...<br />
Other trip costs ............................... ... ... ... ...<br />
Equipment ................................... ... ... ... ...<br />
* Estimate based on a sample size <strong>of</strong> 10–29. … Sample size too small (less than 10) to report data reliably.<br />
1<br />
Average expenditures are annual estimates.<br />
Note: Detail does not add to total because <strong>of</strong> multiple responses <strong>and</strong> nonresponse. See Table 20 for detailed listing <strong>of</strong> expenditure items.<br />
U.S. Fish <strong>and</strong> Wildlife Service <strong>and</strong> U.S. <strong>Census</strong> <strong>Bureau</strong> <strong>2011</strong> <strong>National</strong> <strong>Survey</strong> <strong>of</strong> <strong>Fishing</strong>, <strong>Hunting</strong>, <strong>and</strong> Wildlife-Associated Recreation—Vermont 27


