

2011 National Survey of Fishing, Hunting, and ... - Census Bureau
2011 National Survey of Fishing, Hunting, and ... - Census Bureau
2011 National Survey of Fishing, Hunting, and ... - Census Bureau

You also want an ePaper? Increase the reach of your titles
YUMPU automatically turns print PDFs into web optimized ePapers that Google loves.
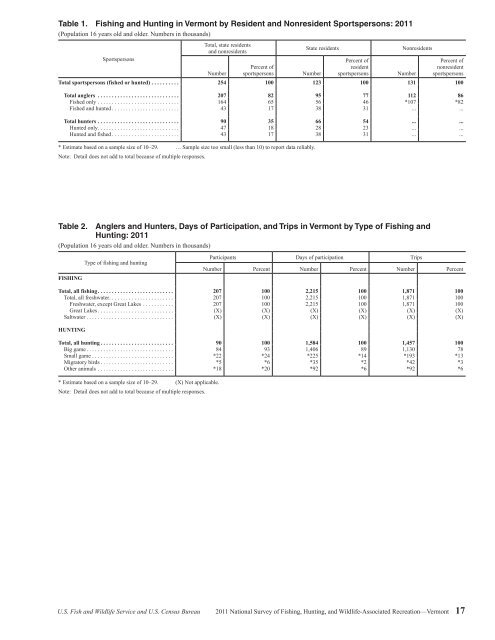
Table 1. <strong>Fishing</strong> <strong>and</strong> <strong>Hunting</strong> in Vermont by Resident <strong>and</strong> Nonresident Sportspersons: <strong>2011</strong><br />
(Population 16 years old <strong>and</strong> older. Numbers in thous<strong>and</strong>s)<br />
Sportspersons<br />
Total, state residents<br />
<strong>and</strong> nonresidents<br />
Number<br />
Percent <strong>of</strong><br />
sportspersons<br />
State residents<br />
Number<br />
Percent <strong>of</strong><br />
resident<br />
sportspersons<br />
Nonresidents<br />
Number<br />
Percent <strong>of</strong><br />
nonresident<br />
sportspersons<br />
Total sportspersons (fished or hunted) .......... 254 100 123 100 131 100<br />
Total anglers ............................. 207 82 95 77 112 86<br />
Fished only ............................. 164 65 56 46 *107 *82<br />
Fished <strong>and</strong> hunted ........................ 43 17 38 31 ... ...<br />
Total hunters ............................. 90 35 66 54 ... ...<br />
Hunted only ............................. 47 18 28 23 ... ...<br />
Hunted <strong>and</strong> fished ........................ 43 17 38 31 ... ...<br />
* Estimate based on a sample size <strong>of</strong> 10–29. … Sample size too small (less than 10) to report data reliably.<br />
Note: Detail does not add to total because <strong>of</strong> multiple responses.<br />
Table 2. Anglers <strong>and</strong> Hunters, Days <strong>of</strong> Participation, <strong>and</strong> Trips in Vermont by Type <strong>of</strong> <strong>Fishing</strong> <strong>and</strong><br />
<strong>Hunting</strong>: <strong>2011</strong><br />
(Population 16 years old <strong>and</strong> older. Numbers in thous<strong>and</strong>s)<br />
FISHING<br />
Type <strong>of</strong> fishing <strong>and</strong> hunting<br />
Participants Days <strong>of</strong> participation Trips<br />
Number Percent Number Percent Number Percent<br />
Total, all fishing ........................... 207 100 2,215 100 1,871 100<br />
Total, all freshwater ....................... 207 100 2,215 100 1,871 100<br />
Freshwater, except Great Lakes ........... 207 100 2,215 100 1,871 100<br />
Great Lakes ........................... (X) (X) (X) (X) (X) (X)<br />
Saltwater ............................... (X) (X) (X) (X) (X) (X)<br />
HUNTING<br />
Total, all hunting .......................... 90 100 1,584 100 1,457 100<br />
Big game ............................... 84 93 1,406 89 1,130 78<br />
Small game ............................. *22 *24 *225 *14 *193 *13<br />
Migratory birds .......................... *5 *6 *35 *2 *42 *3<br />
Other animals ........................... *18 *20 *92 *6 *92 *6<br />
* Estimate based on a sample size <strong>of</strong> 10–29. (X) Not applicable.<br />
Note: Detail does not add to total because <strong>of</strong> multiple responses.<br />
U.S. Fish <strong>and</strong> Wildlife Service <strong>and</strong> U.S. <strong>Census</strong> <strong>Bureau</strong> <strong>2011</strong> <strong>National</strong> <strong>Survey</strong> <strong>of</strong> <strong>Fishing</strong>, <strong>Hunting</strong>, <strong>and</strong> Wildlife-Associated Recreation—Vermont 17


