

2011 National Survey of Fishing, Hunting, and ... - Census Bureau
2011 National Survey of Fishing, Hunting, and ... - Census Bureau
2011 National Survey of Fishing, Hunting, and ... - Census Bureau

You also want an ePaper? Increase the reach of your titles
YUMPU automatically turns print PDFs into web optimized ePapers that Google loves.
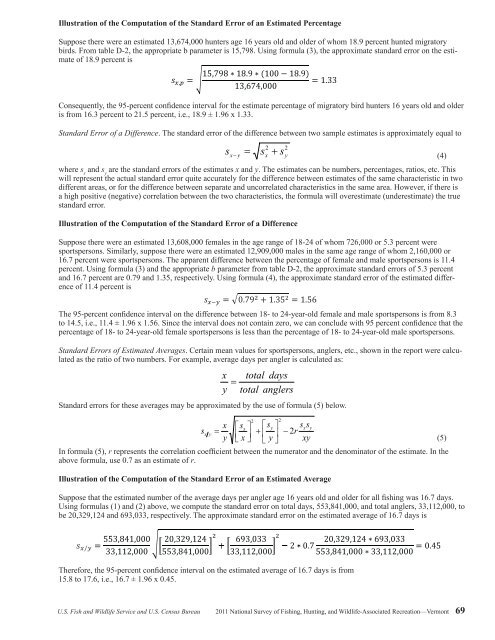
Illustration <strong>of</strong> the Computation <strong>of</strong> the St<strong>and</strong>ard Error <strong>of</strong> an Estimated Percentage<br />
Suppose there were an estimated 13,674,000 hunters age 16 years old <strong>and</strong> older <strong>of</strong> whom 18.9 percent hunted migratory<br />
birds. From table D-2, the appropriate b parameter is 15,798. Using formula (3), the approximate st<strong>and</strong>ard error on the estimate<br />
<strong>of</strong> 18.9 percent is<br />
5, 756 18. 3 100 , . <br />
18.<br />
3<br />
,<br />
5 5756 , 756 1818 3. 3 100 100<br />
1818 . 3<br />
.<br />
3083<br />
.<br />
s xp s , xp ,<br />
12, 510,<br />
000<br />
083<br />
. 083 .<br />
12 12 , 510 , 510 , 000 , 000<br />
s xp<br />
Consequently, the 95-percent confidence interval for the estimate percentage <strong>of</strong> migratory bird hunters 16 years old <strong>and</strong> older<br />
Consequently,<br />
is from Consequently, 16.7<br />
the<br />
percent<br />
95-percent the the to 19.9 95-percent confidence<br />
percent, confidence interval<br />
ie. 18.3<br />
for interval<br />
± interval 1.96<br />
the estimate<br />
x<br />
for<br />
0.83. for the the percentage estimate estimate percentage <strong>of</strong> migratory <strong>of</strong> <strong>of</strong> bird migratory hunters bird bird 16 hunters hunters years 16 old 16 years <strong>and</strong> years older<br />
old <strong>and</strong> <strong>and</strong> older olde<br />
is from 16.3 is is from percent from 16.7 16.7 to percent 21.5 percent percent, to to 19.9 19.9 i.e., percent, percent, 18.9 ie. ± ie. 1.96 18.3 18.3 x ± 1.33. 1.96 ± 1.96 x 0.83. x 0.83.<br />
St<strong>and</strong>ard Error <strong>of</strong> a Difference. The st<strong>and</strong>ard error <strong>of</strong> the difference between two sample estimates is approximately equal to<br />
St<strong>and</strong>ard Error St<strong>and</strong>ard <strong>of</strong> a Error Difference. Error <strong>of</strong> <strong>of</strong> a a Difference. The st<strong>and</strong>ard The The error st<strong>and</strong>ard st<strong>and</strong>ard <strong>of</strong> the error error difference <strong>of</strong> <strong>of</strong> the the between difference two between between sample two two estimates sample sample is estimates approximately is is approximately equal to equal equal to to<br />
2 2<br />
sxsy s<br />
x y x2s2 sxy<br />
2 2<br />
(4)<br />
s s<br />
(4) (4)<br />
x y xysy<br />
(4)<br />
where<br />
where s x<br />
<strong>and</strong> where sx<br />
<strong>and</strong><br />
s y<br />
are sx<br />
<strong>and</strong> sy<br />
are the st<strong>and</strong>ard errors <strong>of</strong> the estimates x <strong>and</strong> y. The estimates can be numbers, percentages, ratios, etc. This<br />
will represent where the sy<br />
st<strong>and</strong>ard are the st<strong>and</strong>ard errors <strong>of</strong> errors the estimates <strong>of</strong> the x <strong>and</strong> y. The x <strong>and</strong> estimates y. The can be numbers, can percentages, ratios, etc. ratios, This etc. This<br />
sx<br />
<strong>and</strong> the actual sy<br />
are the st<strong>and</strong>ard st<strong>and</strong>ard error errors quite <strong>of</strong> accurately the estimates for the x <strong>and</strong> difference y. The estimates between estimates can be numbers, <strong>of</strong> the same percentages, characteristic ratios, in etc. two This<br />
will represent<br />
different<br />
will will the<br />
areas, represent actual<br />
or<br />
the<br />
for<br />
st<strong>and</strong>ard the actual<br />
the actual difference<br />
st<strong>and</strong>ard error st<strong>and</strong>ard quite<br />
between<br />
error accurately error quite quite separate for accurately the<br />
<strong>and</strong><br />
difference<br />
uncorrelated<br />
for for the the between difference characteristics<br />
estimates between between in<br />
<strong>of</strong> estimates the<br />
the<br />
same<br />
same <strong>of</strong> <strong>of</strong> area.<br />
the characteristic the same<br />
However, same characteristic in<br />
if<br />
two<br />
there<br />
in in two two<br />
different<br />
a high<br />
different areas, different positive<br />
or areas, for areas, (negative)<br />
the or difference or for for the<br />
correlation the between difference between<br />
separate between between the<br />
<strong>and</strong> separate<br />
two separate uncorrelated<br />
characteristics,<br />
<strong>and</strong> <strong>and</strong> uncorrelated characteristics<br />
the formula characteristics in<br />
will<br />
the<br />
overestimate<br />
same in in the area. the same same However,<br />
(underestimate)<br />
area. area. if However, there is<br />
the<br />
if<br />
true if there there is is<br />
a high<br />
st<strong>and</strong>ard<br />
positive a high a high error.<br />
(negative) positive positive correlation (negative) correlation between between the between two characteristics, the the two two characteristics, the formula the the will formula formula overestimate will will overestimate (underestimate) (underestimate) the true the the true true<br />
st<strong>and</strong>ard st<strong>and</strong>ard error. st<strong>and</strong>ard error. error.<br />
Illustration <strong>of</strong> the Computation <strong>of</strong> the St<strong>and</strong>ard Error <strong>of</strong> a Difference<br />
Illustration Illustration <strong>of</strong> the Computation <strong>of</strong> <strong>of</strong> the the Computation <strong>of</strong> the St<strong>and</strong>ard <strong>of</strong> <strong>of</strong> the the Error St<strong>and</strong>ard <strong>of</strong> Error a Error Difference <strong>of</strong> <strong>of</strong> a a Difference<br />
In Table 8, <strong>of</strong> the 11,655,000 females in the age range <strong>of</strong> 18-24, 726,000 or 6.2 percent are sportspersons. Similarly, <strong>of</strong> the<br />
Suppose<br />
11,638,000<br />
In there In Table Table were<br />
males<br />
8, 8, an <strong>of</strong> <strong>of</strong> the estimated<br />
in the the 11,655,000 same<br />
13,608,000<br />
age<br />
females<br />
range, females females<br />
1,929,000<br />
in in the the age in age the range<br />
or range age<br />
16.6<br />
<strong>of</strong> range<br />
percent <strong>of</strong> 18-24, 18-24, <strong>of</strong> 18-24<br />
are<br />
726,000 726,000 sportspersons.<br />
<strong>of</strong> whom or 6.2 6.2 percent 726,000 percent The<br />
are<br />
apparent<br />
or are 5.3 sportspersons. percent<br />
difference<br />
were<br />
between Similarly, <strong>of</strong> <strong>of</strong> the the<br />
sportspersons.<br />
the percent 11,638,000 Similarly,<br />
<strong>of</strong> female<br />
males males suppose in<br />
<strong>and</strong> in the<br />
male the same there same participants<br />
age were age range, range, estimated<br />
is 10.4 1,929,000 percent.<br />
12,909,000 or or 16.6 16.6 Using<br />
percent males percent formula<br />
in are are the (3) sportspersons. same<br />
<strong>and</strong><br />
age<br />
the appropriate<br />
range The The <strong>of</strong> apparent whom apparent b parameter<br />
2,160,000 difference from<br />
or between between table<br />
16.7 percent<br />
D-7,<br />
the<br />
the percent were<br />
approximate percent sportspersons. <strong>of</strong> <strong>of</strong> female female st<strong>and</strong>ard<br />
<strong>and</strong> The male<br />
errors male apparent participants <strong>of</strong> 6.2<br />
difference<br />
percent<br />
is is 10.4 10.4 <strong>and</strong><br />
between percent.<br />
16.6 percent. the<br />
percent<br />
Using percentage Using are<br />
formula formula 0.55<br />
<strong>of</strong><br />
<strong>and</strong><br />
female (3) (3) 0.85,<br />
<strong>and</strong> <strong>and</strong> <strong>and</strong> the<br />
respectively. the male appropriate sportspersons<br />
Using<br />
b b parameter formula<br />
is 11.4 from<br />
(4), from table<br />
the table<br />
percent.<br />
approximate<br />
Using D-7, D-7, the formula the st<strong>and</strong>ard approximate (3) <strong>and</strong><br />
error<br />
st<strong>and</strong>ard the st<strong>and</strong>ard <strong>of</strong><br />
appropriate<br />
the estimated<br />
errors errors <strong>of</strong> b <strong>of</strong> parameter 6.2<br />
difference 6.2 percent percent from<br />
<strong>of</strong><br />
<strong>and</strong> <strong>and</strong> 10.4<br />
table 16.6 16.6 percent<br />
percent D-2, percent the<br />
is<br />
are approximate are 0.55 0.55 <strong>and</strong> <strong>and</strong> 0.85, st<strong>and</strong>ard 0.85, respectively. errors <strong>of</strong> Using 5.3 Using percent formula formula (4), (4), the the<br />
<strong>and</strong> 16.7 percent approximate are 0.79 st<strong>and</strong>ard st<strong>and</strong>ard 1.35, error error respectively. <strong>of</strong> <strong>of</strong> the the estimated Using difference formula <strong>of</strong> (4), <strong>of</strong> 10.4 the 10.4 percent approximate percent is is st<strong>and</strong>ard error <strong>of</strong> the estimated difference<br />
<strong>of</strong> 11.4 percent is<br />
2 2<br />
s x<br />
<br />
s y<br />
055 . 20 2<br />
x s xy<br />
y<br />
055 . 2. 85 102<br />
055 0 . 85<br />
2.<br />
. 0. 85 102<br />
. 102 .<br />
The 95-percent confidence interval on the difference between 18-24 year old female <strong>and</strong> male sportspersons is from 8.4 to<br />
The 95-percent<br />
12.4,<br />
The The i.e., 10.4 95-percent confidence<br />
± 1.96 confidence interval<br />
x 1.02. Since<br />
interval interval the<br />
the<br />
difference on<br />
interval on the the between difference does not<br />
18- between<br />
contain between to 24-year-old<br />
zero,<br />
18-24 18-24 we<br />
year year can<br />
female old<br />
conclude old female <strong>and</strong> female male<br />
with<br />
<strong>and</strong> <strong>and</strong> male sportspersons<br />
95 male percent sportspersons confidence<br />
is from is is from 8.3<br />
that from 8.4<br />
the 8.4 to to<br />
to 14.5,<br />
percentage<br />
i.e., 12.4, 12.4, 11.4 i.e., i.e., <strong>of</strong><br />
± 10.4 1.96<br />
18-24 10.4 ± x 1.96 ± year<br />
1.56. 1.96 x<br />
old<br />
Since 1.02. x 1.02. female<br />
the Since Since interval the interval does not does contain not contain zero, we zero, can we conclude can with 95 with percent 95 percent confidence that the that the<br />
percentage <strong>of</strong> 18- to <strong>of</strong> 24-year-old 18-24 year female old 15.8 sportspersons the interval<br />
female sportspersons to 17.6, i.e., is 16.7 is less does<br />
less is than ± than not<br />
less 1.96 the contain<br />
the than x percentage 0.45. percentage zero, we <strong>of</strong> can 18-24 conclude year old with male 95 sportspersons.<br />
percent confidence that the<br />
percentage <strong>of</strong> 18-24 year old female sportspersons is less than the the percentage <strong>of</strong> 18- <strong>of</strong> to <strong>of</strong> 18-24 24-year-old 18-24 old male old male male sportspersons.<br />
St<strong>and</strong>ard Errors <strong>of</strong> Estimated Averages. Certain mean values for sportspersons, anglers, etc., shown in the report were calculated<br />
Errors<br />
St<strong>and</strong>ard<br />
as St<strong>and</strong>ard the<br />
<strong>of</strong><br />
ratio<br />
Errors Estimated Errors <strong>of</strong> two<br />
<strong>of</strong> <strong>of</strong> numbers.<br />
Averages. Estimated For<br />
Certain Averages. example,<br />
mean Certain Certain average<br />
values mean mean for<br />
days<br />
values sportspersons, values per<br />
for<br />
angler for sportspersons, is<br />
anglers,<br />
calculated<br />
etc., anglers,<br />
as: anglers, shown etc., etc., in shown the shown report in in the were the report report calculated<br />
as the lated lated ratio as as <strong>of</strong> the the two ratio ratio numbers. <strong>of</strong> <strong>of</strong> two two For numbers. example, For For average example, days average average per angler days days per is per calculated angler angler is is as: calculated as:<br />
were were calcu-<br />
calcu<br />
as:<br />
x<br />
y<br />
total days<br />
x<br />
x total days<br />
<br />
total days<br />
total anglers<br />
y y total total anglers<br />
St<strong>and</strong>ard errors for these averages may be approximated by the use <strong>of</strong> formula (5) below.<br />
St<strong>and</strong>ard St<strong>and</strong>ard errors St<strong>and</strong>ard for errors these errors for averages for these these averages may averages be approximated may may be be approximated by the use by <strong>of</strong> by the formula the use use <strong>of</strong> <strong>of</strong> (5) formula formula below. (5) (5) below. below.<br />
x s<br />
2 s<br />
x s<br />
s<br />
s<br />
r ss<br />
x y x y<br />
x y<br />
(5) (5)<br />
y <br />
x <br />
2 s<br />
<br />
s<br />
s<br />
y<br />
2 r ss<br />
x y x y<br />
x y<br />
(5)<br />
y <br />
x <br />
2<br />
s<br />
<br />
r ss<br />
x y x y<br />
x y<br />
y<br />
<br />
(5)<br />
y <br />
x <br />
<br />
<br />
y<br />
2<br />
xy2<br />
<br />
xy xy<br />
In formula In formula (5), r (5), represents r represents the correlation the correlation coefficient coefficient between between the numerator the numerator <strong>and</strong> the <strong>and</strong> denominator the denominator <strong>of</strong> the <strong>of</strong> estimate. the estimate. In the In the<br />
above formula, In formula use 0.7 (5), as r an estimate the <strong>of</strong> r. 15.8 to 17.6, i.e., 16.7 between ± 1.96 the x 0.45.<br />
above In formula, use (5), 0.7 r represents as an estimate the correlation <strong>of</strong> r. coefficient between the numerator <strong>and</strong> <strong>and</strong> the the denominator <strong>of</strong> <strong>of</strong> the the estimate. In In the the<br />
above above formula, formula, use use 0.7 0.7 as as an an estimate estimate <strong>of</strong> <strong>of</strong> r. r.<br />
Illustration Illustration <strong>of</strong> the <strong>of</strong> Computation the Computation <strong>of</strong> the <strong>of</strong> St<strong>and</strong>ard the St<strong>and</strong>ard Error Error <strong>of</strong> an <strong>of</strong> Estimated an Estimated Average Average<br />
Illustration <strong>of</strong> <strong>of</strong> the the Computation <strong>of</strong> <strong>of</strong> the the St<strong>and</strong>ard Error Error <strong>of</strong> <strong>of</strong> an an Estimated Average Average<br />
Suppose Table that 2 the shows estimated that the number average <strong>of</strong> days the per average angler days 16 per years angler old <strong>and</strong> age older 16 years for all old fishing <strong>and</strong> older was for 17.3 all days. fishing Using was 16.7 formulas days. (1) <strong>and</strong><br />
Using (2) formulas Table<br />
above, Table 2 (1) we<br />
shows 2 shows <strong>and</strong> compute<br />
that (2) that above, the<br />
the the average<br />
st<strong>and</strong>ard average we compute days<br />
error days per<br />
on the per angler<br />
total st<strong>and</strong>ard angler days,<br />
16 16 years error years 516,781,000,<br />
old on old total <strong>and</strong> <strong>and</strong> older days, <strong>and</strong> older for<br />
total 553,841,000, for all<br />
anglers, all fishing fishing 29,952,000,<br />
was <strong>and</strong> was 17.3 total 17.3 days. anglers, days. to be<br />
Using<br />
15,828,079 Using 33,112,000, formulas formulas <strong>and</strong> to (1) (1) <strong>and</strong> <strong>and</strong><br />
be 20,329,124 399,342,<br />
(2) (2) above, above, <strong>and</strong> respectively. 693,033, we we compute compute respectively. The<br />
the<br />
approximate the st<strong>and</strong>ard st<strong>and</strong>ard The error approximate st<strong>and</strong>ard error on on total<br />
error total days, st<strong>and</strong>ard on days, the 516,781,000, estimated error on the average<br />
<strong>and</strong> estimated <strong>and</strong> total total <strong>of</strong><br />
anglers,<br />
17.3 anglers, average days 29,952,000, is <strong>of</strong> 16.7 days to to isbe 15,828,079 <strong>and</strong> <strong>and</strong><br />
399,342, 399,342, respectively. The The approximate st<strong>and</strong>ard st<strong>and</strong>ard error error on on the the estimated average average <strong>of</strong> <strong>of</strong> 17.3 17.3 days days is is<br />
2 2<br />
2 2<br />
516, 781,<br />
000 158, 280,<br />
079 2 2<br />
516 781 000 <br />
<br />
s xy<br />
<br />
<br />
2<br />
, , 158 , 280,<br />
079 <br />
<br />
399,<br />
342 <br />
15, 828, 079 399,<br />
342<br />
s xy<br />
<br />
2<br />
07 .<br />
0 40<br />
29, 952,<br />
000 516 <br />
.<br />
, 781,<br />
000 s xy<br />
516, 781,<br />
000 158 280,<br />
079<br />
<br />
<br />
29 399,<br />
342 <br />
15, 828, 079 399,<br />
342<br />
<br />
399,<br />
342 <br />
15, 828, 079 399,<br />
342<br />
2<br />
07 .<br />
0.<br />
40<br />
29, 952,<br />
000 516, 781,<br />
000 29, 952,<br />
000<br />
, 952,<br />
000 <br />
<br />
2516 07 . , 781, 000 29, 952,<br />
000 0.<br />
40<br />
29 952,<br />
000 516, 781,<br />
000 29 952,<br />
000<br />
516 516 , 781 , 781 , 000 , 000<br />
2929 , 952 952 , 000 , 000<br />
Therefore, the 95-percent confidence interval on the estimated average <strong>of</strong> 16.7 days is from<br />
15.8 to Therefore, 17.6, i.e., the 16.7 95-percent ± 1.96 x 0.45. confidence interval on the estimated average <strong>of</strong> 17.3 days is from<br />
16.5 to Therefore, 18.0, i.e.,<br />
the the 17.3 95-percent ± 1.96 x 0.40. confidence interval interval on on the the estimated average average <strong>of</strong> <strong>of</strong> 17.3 17.3 days days is is from from<br />
16.5 16.5 to to 18.0, 18.0, i.e., i.e., 17.3 17.3 ± 1.96 ± 1.96 x 0.40. x 0.40.<br />
U.S. Fish <strong>and</strong> Wildlife Service <strong>and</strong> U.S. <strong>Census</strong> <strong>Bureau</strong> <strong>2011</strong> <strong>National</strong> <strong>Survey</strong> <strong>of</strong> <strong>Fishing</strong>, <strong>Hunting</strong>, <strong>and</strong> Wildlife-Associated Recreation—Vermont 69<br />
15.8 to 17.6, i.e., 16.7 ± 1.96 x 0.45.


