

2011 National Survey of Fishing, Hunting, and ... - Census Bureau
2011 National Survey of Fishing, Hunting, and ... - Census Bureau
2011 National Survey of Fishing, Hunting, and ... - Census Bureau

You also want an ePaper? Increase the reach of your titles
YUMPU automatically turns print PDFs into web optimized ePapers that Google loves.
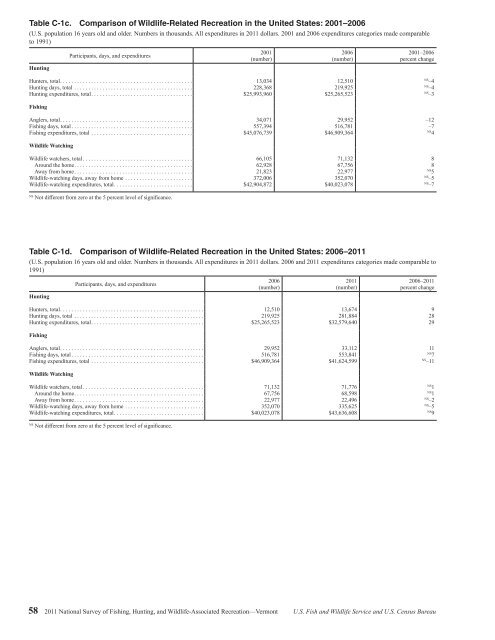
Table C-1c. Comparison <strong>of</strong> Wildlife-Related Recreation in the United States: 2001–2006<br />
(U.S. population 16 years old <strong>and</strong> older. Numbers in thous<strong>and</strong>s. All expenditures in <strong>2011</strong> dollars. 2001 <strong>and</strong> 2006 expenditures categories made comparable<br />
to 1991)<br />
<strong>Hunting</strong><br />
Participants, days, <strong>and</strong> expenditures<br />
2001<br />
(number)<br />
2006<br />
(number)<br />
2001–2006<br />
percent change<br />
Hunters, total ............................................... 13,034 12,510<br />
NS<br />
–4<br />
<strong>Hunting</strong> days, total .......................................... 228,368 219,925<br />
NS<br />
–4<br />
<strong>Hunting</strong> expenditures, total .................................... $25,993,960 $25,265,523<br />
NS<br />
–3<br />
<strong>Fishing</strong><br />
Anglers, total ............................................... 34,071 29,952 –12<br />
<strong>Fishing</strong> days, total ........................................... 557,394 516,781 –7<br />
<strong>Fishing</strong> expenditures, total .................................... $45,076,739 $46,909,364<br />
NS<br />
4<br />
Wildlife Watching<br />
Wildlife watchers, total ....................................... 66,105 71,132 8<br />
Around the home .......................................... 62,928 67,756 8<br />
Away from home .......................................... 21,823 22,977<br />
NS<br />
5<br />
Wildlife-watching days, away from home ........................ 372,006 352,070<br />
NS<br />
–5<br />
Wildlife-watching expenditures, total ............................ $42,904,872 $40,023,078<br />
NS<br />
–7<br />
NS<br />
Not different from zero at the 5 percent level <strong>of</strong> significance.<br />
Table C-1d. Comparison <strong>of</strong> Wildlife-Related Recreation in the United States: 2006–<strong>2011</strong><br />
(U.S. population 16 years old <strong>and</strong> older. Numbers in thous<strong>and</strong>s. All expenditures in <strong>2011</strong> dollars. 2006 <strong>and</strong> <strong>2011</strong> expenditures categories made comparable to<br />
1991)<br />
<strong>Hunting</strong><br />
Participants, days, <strong>and</strong> expenditures<br />
2006<br />
(number)<br />
<strong>2011</strong><br />
(number)<br />
2006–<strong>2011</strong><br />
percent change<br />
Hunters, total ................................................... 12,510 13,674 9<br />
<strong>Hunting</strong> days, total .............................................. 219,925 281,884 28<br />
<strong>Hunting</strong> expenditures, total ........................................ $25,265,523 $32,579,640 29<br />
<strong>Fishing</strong><br />
Anglers, total ................................................... 29,952 33,112 11<br />
<strong>Fishing</strong> days, total ............................................... 516,781 553,841<br />
NS<br />
7<br />
<strong>Fishing</strong> expenditures, total ........................................ $46,909,364 $41,624,599<br />
NS<br />
–11<br />
Wildlife Watching<br />
Wildlife watchers, total ........................................... 71,132 71,776<br />
NS<br />
1<br />
Around the home .............................................. 67,756 68,598<br />
NS<br />
1<br />
Away from home .............................................. 22,977 22,496<br />
NS<br />
–2<br />
Wildlife-watching days, away from home ............................ 352,070 335,625<br />
NS<br />
–5<br />
Wildlife-watching expenditures, total ................................ $40,023,078 $43,636,608<br />
NS<br />
9<br />
NS<br />
Not different from zero at the 5 percent level <strong>of</strong> significance.<br />
58 <strong>2011</strong> <strong>National</strong> <strong>Survey</strong> <strong>of</strong> <strong>Fishing</strong>, <strong>Hunting</strong>, <strong>and</strong> Wildlife-Associated Recreation—Vermont U.S. Fish <strong>and</strong> Wildlife Service <strong>and</strong> U.S. <strong>Census</strong> <strong>Bureau</strong>


