

2011 National Survey of Fishing, Hunting, and ... - Census Bureau
2011 National Survey of Fishing, Hunting, and ... - Census Bureau
2011 National Survey of Fishing, Hunting, and ... - Census Bureau

You also want an ePaper? Increase the reach of your titles
YUMPU automatically turns print PDFs into web optimized ePapers that Google loves.
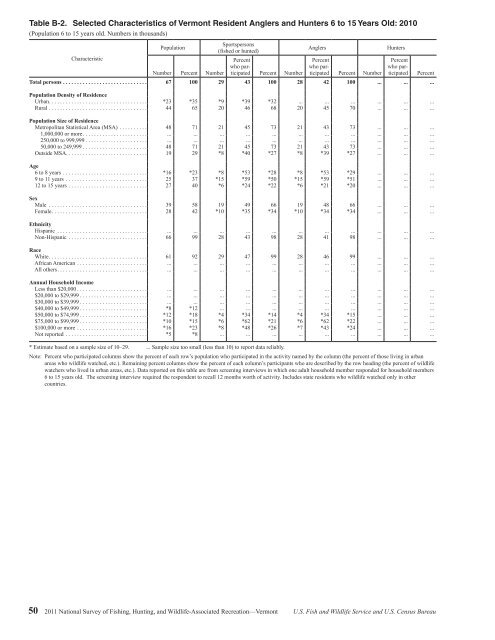
Table B-2. Selected Characteristics <strong>of</strong> Vermont Resident Anglers <strong>and</strong> Hunters 6 to 15 Years Old: 2010<br />
(Population 6 to 15 years old. Numbers in thous<strong>and</strong>s)<br />
Characteristic<br />
Population<br />
Number Percent Number<br />
Sportspersons<br />
(fished or hunted)<br />
Percent<br />
who participated<br />
Percent Number<br />
Anglers<br />
Percent<br />
who participated<br />
Percent Number<br />
Hunters<br />
Percent<br />
who participated<br />
Total persons .............................. 67 100 29 43 100 28 42 100 ... ... ...<br />
Population Density <strong>of</strong> Residence<br />
Urban ................................... *23 *35 *9 *39 *32 ... ... ... ... ... ...<br />
Rural ................................... 44 65 20 46 68 20 45 70 ... ... ...<br />
Population Size <strong>of</strong> Residence<br />
Metropolitan Statistical Area (MSA) .......... 48 71 21 45 73 21 43 73 ... ... ...<br />
1,000,000 or more ....................... ... ... ... ... ... ... ... ... ... ... ...<br />
250,000 to 999,999 ...................... ... ... ... ... ... ... ... ... ... ... ...<br />
50,000 to 249,999 ....................... 48 71 21 45 73 21 43 73 ... ... ...<br />
Outside MSA ............................. 19 29 *8 *40 *27 *8 *39 *27 ... ... ...<br />
Age<br />
6 to 8 years .............................. *16 *23 *8 *53 *28 *8 *53 *29 ... ... ...<br />
9 to 11 years ............................. 25 37 *15 *59 *50 *15 *59 *51 ... ... ...<br />
12 to 15 years ............................ 27 40 *6 *24 *22 *6 *21 *20 ... ... ...<br />
Sex<br />
Male ................................... 39 58 19 49 66 19 48 66 ... ... ...<br />
Female .................................. 28 42 *10 *35 *34 *10 *34 *34 ... ... ...<br />
Ethnicity<br />
Hispanic ................................ ... ... ... ... ... ... ... ... ... ... ...<br />
Non-Hispanic ............................ 66 99 28 43 98 28 41 98 ... ... ...<br />
Race<br />
White ................................... 61 92 29 47 99 28 46 99 ... ... ...<br />
African American ......................... ... ... ... ... ... ... ... ... ... ... ...<br />
All others ................................ ... ... ... ... ... ... ... ... ... ... ...<br />
Annual Household Income<br />
Less than $20,000 ......................... ... ... ... ... ... ... ... ... ... ... ...<br />
$20,000 to $29,999 ........................ ... ... ... ... ... ... ... ... ... ... ...<br />
$30,000 to $39,999 ........................ ... ... ... ... ... ... ... ... ... ... ...<br />
$40,000 to $49,999 ........................ *8 *12 ... ... ... ... ... ... ... ... ...<br />
$50,000 to $74,999 ........................ *12 *18 *4 *34 *14 *4 *34 *15 ... ... ...<br />
$75,000 to $99,999 ........................ *10 *15 *6 *62 *21 *6 *62 *22 ... ... ...<br />
$100,000 or more ......................... *16 *23 *8 *48 *26 *7 *43 *24 ... ... ...<br />
Not reported ............................. *5 *8 ... ... ... ... ... ... ... ... ...<br />
* Estimate based on a sample size <strong>of</strong> 10–29. ... Sample size too small (less than 10) to report data reliably.<br />
Note: Percent who participated columns show the percent <strong>of</strong> each row’s population who participated in the activity named by the column (the percent <strong>of</strong> those living in urban<br />
areas who wildlife watched, etc.). Remaining percent columns show the percent <strong>of</strong> each column’s participants who are described by the row heading (the percent <strong>of</strong> wildlife<br />
watchers who lived in urban areas, etc.). Data reported on this table are from screening interviews in which one adult household member responded for household members<br />
6 to 15 years old. The screening interview required the respondent to recall 12 months worth <strong>of</strong> activity. Includes state residents who wildlife watched only in other<br />
countries.<br />
Percent<br />
50 <strong>2011</strong> <strong>National</strong> <strong>Survey</strong> <strong>of</strong> <strong>Fishing</strong>, <strong>Hunting</strong>, <strong>and</strong> Wildlife-Associated Recreation—Vermont U.S. Fish <strong>and</strong> Wildlife Service <strong>and</strong> U.S. <strong>Census</strong> <strong>Bureau</strong>


