

2011 National Survey of Fishing, Hunting, and ... - Census Bureau
2011 National Survey of Fishing, Hunting, and ... - Census Bureau
2011 National Survey of Fishing, Hunting, and ... - Census Bureau

You also want an ePaper? Increase the reach of your titles
YUMPU automatically turns print PDFs into web optimized ePapers that Google loves.
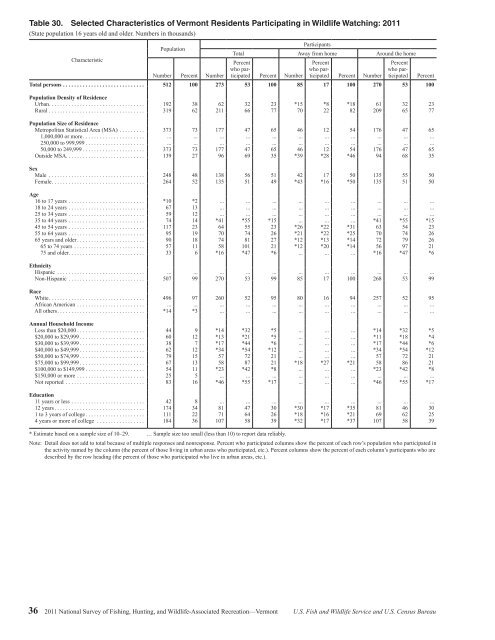
Table 30. Selected Characteristics <strong>of</strong> Vermont Residents Participating in Wildlife Watching: <strong>2011</strong><br />
(State population 16 years old <strong>and</strong> older. Numbers in thous<strong>and</strong>s)<br />
Characteristic<br />
Population<br />
Number Percent Number<br />
Participants<br />
Total Away from home Around the home<br />
Percent<br />
who participated<br />
Percent Number<br />
Percent<br />
who participated<br />
Percent Number<br />
Percent<br />
who participated<br />
Total persons ............................. 512 100 273 53 100 85 17 100 270 53 100<br />
Population Density <strong>of</strong> Residence<br />
Urban .................................. 192 38 62 32 23 *15 *8 *18 61 32 23<br />
Rural .................................. 319 62 211 66 77 70 22 82 209 65 77<br />
Population Size <strong>of</strong> Residence<br />
Metropolitan Statistical Area (MSA) ......... 373 73 177 47 65 46 12 54 176 47 65<br />
1,000,000 or more ...................... ... ... ... ... ... ... ... ... ... ... ...<br />
250,000 to 999,999 ..................... ... ... ... ... ... ... ... ... ... ... ...<br />
50,000 to 249,999 ...................... 373 73 177 47 65 46 12 54 176 47 65<br />
Outside MSA ............................ 139 27 96 69 35 *39 *28 *46 94 68 35<br />
Sex<br />
Male .................................. 248 48 138 56 51 42 17 50 135 55 50<br />
Female ................................. 264 52 135 51 49 *43 *16 *50 135 51 50<br />
Age<br />
16 to 17 years ........................... *10 *2 ... ... ... ... ... ... ... ... ...<br />
18 to 24 years ........................... 67 13 ... ... ... ... ... ... ... ... ...<br />
25 to 34 years ........................... 59 12 ... ... ... ... ... ... ... ... ...<br />
35 to 44 years ........................... 74 14 *41 *55 *15 ... ... ... *41 *55 *15<br />
45 to 54 years ........................... 117 23 64 55 23 *26 *22 *31 63 54 23<br />
55 to 64 years ........................... 95 19 70 74 26 *21 *22 *25 70 74 26<br />
65 years <strong>and</strong> older ........................ 90 18 74 81 27 *12 *13 *14 72 79 26<br />
65 to 74 years ......................... 57 11 58 101 21 *12 *20 *14 56 97 21<br />
75 <strong>and</strong> older ........................... 33 6 *16 *47 *6 ... ... ... *16 *47 *6<br />
Ethnicity<br />
Hispanic ............................... ... ... ... ... ... ... ... ... ... ... ...<br />
Non-Hispanic ........................... 507 99 270 53 99 85 17 100 268 53 99<br />
Race<br />
White .................................. 496 97 260 52 95 80 16 94 257 52 95<br />
African American ........................ ... ... ... ... ... ... ... ... ... ... ...<br />
All others ............................... *14 *3 ... ... ... ... ... ... ... ... ...<br />
Annual Household Income<br />
Less than $20,000 ........................ 44 9 *14 *32 *5 ... ... ... *14 *32 *5<br />
$20,000 to $29,999 ....................... 60 12 *13 *21 *5 ... ... ... *11 *18 *4<br />
$30,000 to $39,999 ....................... 38 7 *17 *44 *6 ... ... ... *17 *44 *6<br />
$40,000 to $49,999 ....................... 62 12 *34 *54 *12 ... ... ... *34 *54 *12<br />
$50,000 to $74,999 ....................... 79 15 57 72 21 ... ... ... 57 72 21<br />
$75,000 to $99,999 ....................... 67 13 58 87 21 *18 *27 *21 58 86 21<br />
$100,000 to $149,999 ..................... 54 11 *23 *42 *8 ... ... ... *23 *42 *8<br />
$150,000 or more ........................ 25 5 ... ... ... ... ... ... ... ... ...<br />
Not reported ............................ 83 16 *46 *55 *17 ... ... ... *46 *55 *17<br />
Education<br />
11 years or less .......................... 42 8 ... ... ... ... ... ... ... ... ...<br />
12 years ................................ 174 34 81 47 30 *30 *17 *35 81 46 30<br />
1 to 3 years <strong>of</strong> college ..................... 111 22 71 64 26 *18 *16 *21 69 62 25<br />
4 years or more <strong>of</strong> college ................. 184 36 107 58 39 *32 *17 *37 107 58 39<br />
* Estimate based on a sample size <strong>of</strong> 10–29. … Sample size too small (less than 10) to report data reliably.<br />
Note: Detail does not add to total because <strong>of</strong> multiple responses <strong>and</strong> nonresponse. Percent who participated columns show the percent <strong>of</strong> each row’s population who participated in<br />
the activity named by the column (the percent <strong>of</strong> those living in urban areas who participated, etc.). Percent columns show the percent <strong>of</strong> each column’s participants who are<br />
described by the row heading (the percent <strong>of</strong> those who participated who live in urban areas, etc.).<br />
Percent<br />
36 <strong>2011</strong> <strong>National</strong> <strong>Survey</strong> <strong>of</strong> <strong>Fishing</strong>, <strong>Hunting</strong>, <strong>and</strong> Wildlife-Associated Recreation—Vermont U.S. Fish <strong>and</strong> Wildlife Service <strong>and</strong> U.S. <strong>Census</strong> <strong>Bureau</strong>


