

2011 National Survey of Fishing, Hunting, and ... - Census Bureau
2011 National Survey of Fishing, Hunting, and ... - Census Bureau
2011 National Survey of Fishing, Hunting, and ... - Census Bureau

Create successful ePaper yourself
Turn your PDF publications into a flip-book with our unique Google optimized e-Paper software.
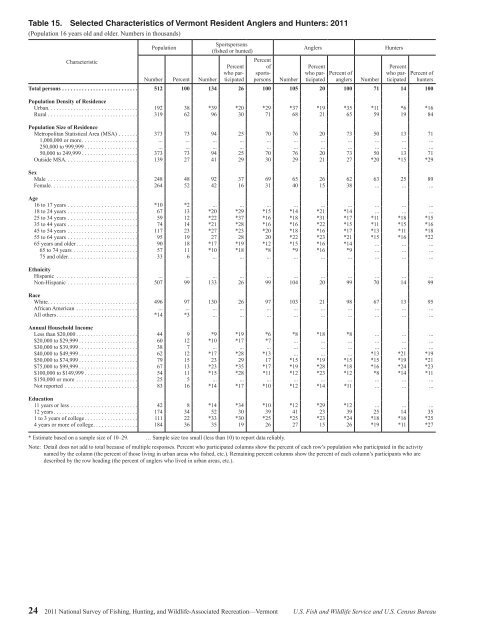
Table 15. Selected Characteristics <strong>of</strong> Vermont Resident Anglers <strong>and</strong> Hunters: <strong>2011</strong><br />
(Population 16 years old <strong>and</strong> older. Numbers in thous<strong>and</strong>s)<br />
Characteristic<br />
Population<br />
Number Percent Number<br />
Sportspersons<br />
(fished or hunted)<br />
Percent<br />
who participated<br />
Percent<br />
<strong>of</strong><br />
sportspersons<br />
Number<br />
Anglers<br />
Percent<br />
who participated<br />
Percent <strong>of</strong><br />
anglers<br />
Number<br />
Hunters<br />
Percent<br />
who participated<br />
Percent <strong>of</strong><br />
hunters<br />
Total persons ........................... 512 100 134 26 100 105 20 100 71 14 100<br />
Population Density <strong>of</strong> Residence<br />
Urban ................................ 192 38 *39 *20 *29 *37 *19 *35 *11 *6 *16<br />
Rural ................................ 319 62 96 30 71 68 21 65 59 19 84<br />
Population Size <strong>of</strong> Residence<br />
Metropolitan Statistical Area (MSA) ....... 373 73 94 25 70 76 20 73 50 13 71<br />
1,000,000 or more .................... ... ... ... ... ... ... ... ... ... ... ...<br />
250,000 to 999,999 ................... ... ... ... ... ... ... ... ... ... ... ...<br />
50,000 to 249,999 .................... 373 73 94 25 70 76 20 73 50 13 71<br />
Outside MSA .......................... 139 27 41 29 30 29 21 27 *20 *15 *29<br />
Sex<br />
Male ................................ 248 48 92 37 69 65 26 62 63 25 89<br />
Female ............................... 264 52 42 16 31 40 15 38 ... ... ...<br />
Age<br />
16 to 17 years ......................... *10 *2 ... ... ... ... ... ... ... ... ...<br />
18 to 24 years ......................... 67 13 *20 *29 *15 *14 *21 *14 ... ... ...<br />
25 to 34 years ......................... 59 12 *22 *37 *16 *18 *31 *17 *11 *18 *15<br />
35 to 44 years ......................... 74 14 *21 *28 *16 *16 *22 *15 *11 *15 *16<br />
45 to 54 years ......................... 117 23 *27 *23 *20 *18 *16 *17 *13 *11 *18<br />
55 to 64 years ......................... 95 19 27 28 20 *22 *23 *21 *15 *16 *22<br />
65 years <strong>and</strong> older ...................... 90 18 *17 *19 *12 *15 *16 *14 ... ... ...<br />
65 to 74 years ....................... 57 11 *10 *18 *8 *9 *16 *9 ... ... ...<br />
75 <strong>and</strong> older ......................... 33 6 ... ... ... ... ... ... ... ... ...<br />
Ethnicity<br />
Hispanic ............................. ... ... ... ... ... ... ... ... ... ... ...<br />
Non-Hispanic ......................... 507 99 133 26 99 104 20 99 70 14 99<br />
Race<br />
White ................................ 496 97 130 26 97 103 21 98 67 13 95<br />
African American ...................... ... ... ... ... ... ... ... ... ... ... ...<br />
All others ............................. *14 *3 ... ... ... ... ... ... ... ... ...<br />
Annual Household Income<br />
Less than $20,000 ...................... 44 9 *9 *19 *6 *8 *18 *8 ... ... ...<br />
$20,000 to $29,999 ..................... 60 12 *10 *17 *7 ... ... ... ... ... ...<br />
$30,000 to $39,999 ..................... 38 7 ... ... ... ... ... ... ... ... ...<br />
$40,000 to $49,999 ..................... 62 12 *17 *28 *13 ... ... ... *13 *21 *19<br />
$50,000 to $74,999 ..................... 79 15 23 29 17 *15 *19 *15 *15 *19 *21<br />
$75,000 to $99,999 ..................... 67 13 *23 *35 *17 *19 *28 *18 *16 *24 *23<br />
$100,000 to $149,999 ................... 54 11 *15 *28 *11 *12 *23 *12 *8 *14 *11<br />
$150,000 or more ...................... 25 5 ... ... ... ... ... ... ... ... ...<br />
Not reported .......................... 83 16 *14 *17 *10 *12 *14 *11 ... ... ...<br />
Education<br />
11 years or less ........................ 42 8 *14 *34 *10 *12 *29 *12 ... ... ...<br />
12 years .............................. 174 34 52 30 39 41 23 39 25 14 35<br />
1 to 3 years <strong>of</strong> college ................... 111 22 *33 *30 *25 *25 *23 *24 *18 *16 *25<br />
4 years or more <strong>of</strong> college ................ 184 36 35 19 26 27 15 26 *19 *11 *27<br />
* Estimate based on a sample size <strong>of</strong> 10–29. … Sample size too small (less than 10) to report data reliably.<br />
Note: Detail does not add to total because <strong>of</strong> multiple responses. Percent who participated columns show the percent <strong>of</strong> each row’s population who participated in the activity<br />
named by the column (the percent <strong>of</strong> those living in urban areas who fished, etc.). Remaining percent columns show the percent <strong>of</strong> each column’s participants who are<br />
described by the row heading (the percent <strong>of</strong> anglers who lived in urban areas, etc.).<br />
24 <strong>2011</strong> <strong>National</strong> <strong>Survey</strong> <strong>of</strong> <strong>Fishing</strong>, <strong>Hunting</strong>, <strong>and</strong> Wildlife-Associated Recreation—Vermont U.S. Fish <strong>and</strong> Wildlife Service <strong>and</strong> U.S. <strong>Census</strong> <strong>Bureau</strong>


